[Preprint]. 2025 Jan 27:2025.01.27.632228.
doi: 10.1101/2025.01.27.632228.

Neuronal Activity-Dependent Gene Dysregulation in C9orf72 i3Neuronal Models of ALS/FTD Pathogenesis

Affiliations

Neuronal Activity-Dependent Gene Dysregulation in C9orf72 i3Neuronal Models of ALS/FTD Pathogenesis

Layla T Ghaffari et al. bioRxiv. .

Update in

Abstract

The GGGGCC nucleotide repeat expansion (NRE) mutation in the C9orf72 (C9) gene is the most common cause of ALS and FTD. Neuronal activity plays an essential role in shaping biological processes within both healthy and neurodegenerative disease scenarios. Here, we show that at baseline conditions, C9-NRE iPSC-cortical neurons display aberrations in several pathways, including synaptic signaling and transcriptional machinery, potentially priming diseased neurons for an altered response to neuronal stimulation. Indeed, exposure to two pathophysiologically relevant stimulation modes, prolonged membrane depolarization, or a blockade of K+ channels, followed by RNA sequencing, induces a temporally divergent activity-dependent transcriptome of C9-NRE cortical neurons compared to healthy controls. This study provides new insights into how neuronal activity influences the ALS/FTD-associated transcriptome, offering a dataset that enables further exploration of pathways necessary for conferring neuronal resilience or degeneration.


Conflict of interest statement

Conflict of Interest The authors declare no conflicts of interest.

Figures

Figure 1.
Figure 1.. C9-NRE i3Neurons are slightly more synchronous and display aberrant levels of synaptic transcripts.
(A) Schematic of the metrics from multi-electrode array recordings. Activity refers to functional readout, oscillation refers to the frequency and pattern of firing, and synchrony refers to the connection between neurons on the electrodes. (B) Weighted mean firing rate is a measure of activity. There are no differences in the weighted mean firing rate of Control and C9-NRE i3Neurons at DIV 25. Network Burst Frequency measured in Hertz (Hz) over the time of the recording shows a slight and nearly significant increase in C9-NRE i3Neurons. The total number of Network Bursts is trending upward in the C9-NRE i3Neurons. Synchrony of C9-NRE i3Neurons, as plotted by the Synchrony Index, shows a nearly significant increase compared to Controls. For each experiment, n = 3 biological replicates, m = 4–9 MEA plates, o = 4–6 wells per plate. Each biological replicate is indicated by a unique shape. Replicates on each plate were collapsed. Unpaired t-tests were performed to determine significance. Error bars represent the SEM. (C) Volcano plot of differentially expressed genes (DEGs) in the comparison between untreated Control i3Neurons and untreated C9-NRE i3Neurons. For each experiment n = 3 biological replicates, m = 2 technical replicates. (D) Enriched Gene Ontology (GO) terms and KEGG pathways for genes upregulated in C9-NRE and Controls are plotted. The log2 fold change of synaptic genes identified to be upregulated in C9-NRE i3Neurons is plotted. Predicted regulators of DEGs in Control i3Neurons are plotted. (F) Predicted transcription factor activity is based on differentially expressed genes downregulated in C9-NRE i3Neuron.
Figure 2.
Figure 2.. TTX-silenced C9-NRE i3Neurons show persistent synaptic transcript dysregulation.
(A) Volcano plot of differentially expressed genes (DEGs) in comparing TTX-silenced Control i3Neurons and TTX-silenced C9-NRE i3Neurons. For each experiment n = 3 biological replicates, m = 2 technical replicates. (B) Enriched Gene Ontology (GO) terms and KEGG pathways for genes upregulated in C9-NRE and Controls are plotted. (C) The log2 fold change of synaptic genes upregulated in C9-NRE i3Neurons is plotted. (D) Predicted transcription factor activity is based on differentially expressed genes downregulated in C9-NRE i3Neuron. (E) Venn diagram of upregulated synaptic genes in the comparison of Con UT vs. C9 UT and Con TTX vs. C9 TTX.
Figure 3.
Figure 3.. The early and late wave of activity-dependent transcription is divergent in C9-NRE i3Neurons.
(A) Schema of the experimental time points of depolarization of i3Neurons prior to harvesting for RNA isolation. (B) RNA Sequencing was performed on KCl-stimulated i3Neurons, and differentially expressed genes (DEGs) were identified using DESeq2. Pairwise comparisons were performed between 0 hours KCl (TTX only) and 2 hours KCl or 6 hours KCl for both Control and C9-NRE i3Neurons. The heatmap shows the gene expression (scaled by z-score) of all DEGs between listed comparisons. (C) Differential gene expression for the early wave of activity-dependent gene transcription, between 0 hours KCl vs 2 hours KCl for both control or C9-NRE i3Neurons was performed. The number of genes uniquely up-regulated or down-regulated in control or C9-NRE i3Neurons are shown in the Venn diagrams. (D) Pathway and gene ontology (GO) analysis were performed on the uniquely up- and down- regulated genes from the comparisons in (C). Pathway analysis includes KEGG and GO analysis includes biological process, molecular function, and cellular component GO terms. The enrichment is displayed as the −log10 of the False Discovery Rate (FDR) for each term. (E) Differential gene expression for the late wave of activity-dependent gene transcription between 0 KCl vs 6 KCl for both control or C9-NRE i3Neurons was performed. The number of genes uniquely up-regulated or down-regulated in control or C9-NRE i3Neurons are shown in the Venn diagrams. (F) Pathway and gene ontology (GO) analysis were performed on the uniquely up- and down- regulated genes from the comparisons in (E). Pathway analysis includes KEGG and GO analysis includes biological process, molecular function, and cellular component GO terms. The enrichment is displayed as the −log10 of the False Discovery Rate (FDR) for each term.
Figure 4.
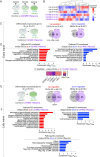
Figure 4.. Profiling temporal dynamic of gene expression following neuronal depolarization captures distinct transcriptomic features dysregulated in C9-NRE i3Neurons.
(A) DEG clusters were identified using maSigPro, a regression-based approach to find genes for significant gene expression profile differences between experimental groups in time course RNA-Seq experiments. (B) Pathway Enrichment/GO for each cluster identified via maSigPro. (C) Transcription factor prediction is based on the differentially expressed genes in each cluster.
Figure 5.
Figure 5.. Modeling the C9-NRE patient hyper- to hypo-excitability spectrum using i3Neurons identifies disease-relevant pathways.
(A) A representative raster plot of i3Neurons loaded with Ca2+ indicator dye Fluo-4 and, following a baseline recording, were stimulated with 4 mM TEA as shown by the arrow at 1 minute. The ΔF/F was calculated per cell using PeakCaller and is plotted. n = 3 biological replicates, m = 3–4 independent experiments per line, o = 50 cells per experiment. (B) DEG clusters were identified using maSigPro, using levels of neuronal activity as pseudo-time. (C) Pathway Enrichment/GO for transcripts divergently regulated in C9-NRE i3Neurons compared to Control i3Neurons following silencing with TTX or activation with TEA.

References

    1. Ababneh NA, Scaber J, Flynn R, Douglas A, Barbagallo P, Candalija A, Turner MR, Sims D, Dafinca R, Cowley SA, Talbot K (2020) Correction of amyotrophic lateral sclerosis related phenotypes in induced pluripotent stem cell-derived motor neurons carrying a hexanucleotide expansion mutation in C9orf72 by CRISPR/Cas9 genome editing using homology-directed repair. Hum Mol Genet 29:2200–2217. - PMC - PubMed
    1. Amick J, Roczniak-Ferguson A, Ferguson SM (2016) C9orf72 binds SMCR8, localizes to lysosomes, and regulates mTORC1 signaling. Mol Biol Cell 27:3040–3051. - PMC - PubMed
    1. Artimovich E, Jackson RK, Kilander MBC, Lin YC, Nestor MW (2017) PeakCaller: an automated graphical interface for the quantification of intracellular calcium obtained by high-content screening. BMC Neurosci 18:72. - PMC - PubMed
    1. Bachmann S, Linde J, Bell M, Spehr M, Zempel H, Zimmer-Bensch G (2021) DNA Methyltransferase 1 (DNMT1) Shapes Neuronal Activity of Human iPSC-Derived Glutamatergic Cortical Neurons. Int J Mol Sci 22. - PMC - PubMed
    1. Bae JS, Simon NG, Menon P, Vucic S, Kiernan MC (2013) The puzzling case of hyperexcitability in amyotrophic lateral sclerosis. J Clin Neurol 9:65–74. - PMC - PubMed

Publication types