[Preprint]. 2025 Feb 3:2025.02.03.636267.
doi: 10.1101/2025.02.03.636267.

Bayesian Inference of Binding Kinetics from Fluorescence Time Series

Affiliations

Bayesian Inference of Binding Kinetics from Fluorescence Time Series

J Shepard Bryan 4th et al. bioRxiv. .

Update in

Abstract

The study of binding kinetics via the analysis of fluorescence time traces is often confounded by measurement noise and photophysics. Although photoblinking can be mitigated by using labels less likely to photoswitch, photobleaching generally cannot be eliminated. Current methods for measuring binding and unbinding rates are therefore limited by concurrent photobleaching events. Here, we propose a method to infer binding and unbinding rates alongside photobleaching rates using fluorescence intensity traces. Our approach is a two-stage process involving analyzing individual regions of interest (ROIs) with a Hidden Markov Model to infer the fluorescence intensity levels of each trace. We then use the inferred intensity level state trajectory from all ROIs to infer kinetic rates. Our method has several advantages, including the ability to analyze noisy traces, account for the presence of photobleaching events, and provide uncertainties associated with the inferred binding kinetics. We demonstrate the effectiveness and reliability of our method through simulations and data from DNA origami binding experiments.


Conflict of interest statement

Competing Interests SP and JSB acknowledge a competing interest with their affiliation with Saguaro Solutions.

Figures

Figure 1:
Figure 1:
Illustration of a fluorescence intensity time trace. A hypothetical fluorescence intensity trace from a fluorescent ligand binding experiment. Circles are drawn around the three key regions indicating a binding event, an unbinding event, and a photobleaching event, respectively. Of note is the inability to distinguish unbinding from bleaching by eye.
Figure 2:
Figure 2:
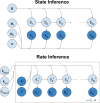
Graphical model of our analysis. Nodes (circles) represent random variables. Dark nodes represent measurements. Arrows between nodes represent conditional dependence. Plates (dashed rectangles) around nodes represent groupings of variables, which are repeated along the index in the lower right corner. In the top of this figure we present our graphical model for State Inference. In the bottom of this figure we present our graphical model for Rate Inference. All variables are defined in the main body.
Figure 3:
Figure 3:
Illustration of the new rectangular DNA origami (NRO) structure and its binding site arrangement. Each row provides information about DNA origami with a set number of S1 docking sites- (a) one binding site, (b) two binding sites, (c) five binding sites. The left column shows cartoon of the DNA origami with the imager strands (red) binding to the S1 docking sites and a stable reference label on three S2 docking sites (green). The middle column shows a diagram of the layout of binding sites and reference labels on the DNA origami. The right column shows atomic force microscopy images of the DNA origami immobilised on a mica surface.
Figure 4:
Figure 4:
Simulated data with different kbind binding rates. The top two rows of the left column show example traces from data simulated with kbind=1mHz/nM, the middle two rows of the left column show example traces from data simulated with kbind=2mHz/nM, and the bottom two rows of the left column show traces from data simulated with kbind=5mHz/nM. The middle column shows inferred posteriors over binding rates, with blue indicating the probability distribution and a red line indicating the ground truth used for simulation. The right column shows inferred posteriors over unbinding rates, with blue indicating the probability distribution and red lines indicating ground truth values used for simulation. Dataset included 200 traces per condition. The parameters used in simulation are specified in main text and table SI4.
Figure 5:
Figure 5:
Simulated data with different kun unbinding rates. The top two rows of the left column show example traces from data simulated with kun=10mHz, the middle two rows of the left column show example traces from data simulated with kun=20mHz, and the bottom two rows of the left column show traces from data simulated with kun=50mHz. The middle column shows inferred posteriors over binding rates, with blue indicating the probability distribution and a red line indicating the ground truth used for simulation. The right column shows inferred posteriors over unbinding rates, with blue indicating the probability distribution and red lines indicating ground truth values used for simulation. Dataset included 200 traces per condition. The parameters used in simulation are specified in main text.
Figure 6:
Figure 6:
Simulated data with different kbleach photobleaching rates. The top two rows of the left column show example traces from data simulated with kbleach=.01mHz, the middle two rows of the left column show example traces from data simulated with kbleach=.02mHz, and the bottom two rows of the left column show traces from data simulated with kbleach=.05mHz. The middle column shows inferred posteriors over binding rates, with blue indicating the probability distribution and a red line indicating the ground truth used for simulation. The right column shows inferred posteriors over unbinding rates, with blue indicating the probability distribution and red lines indicating ground truth values used for simulation. Dataset included 200 traces per condition. The parameters used in simulation are specified in main text and table SI4.
Figure 7:
Figure 7:
Simulated data with different number of ROIs. The top two rows of the left column show example traces from data simulated with 2000 ROIs, the middle two rows of the left column show example traces from data with 1000 ROIs, and the bottom two rows of the left column show traces from data with 400 ROIs. The middle column shows inferred posteriors over binding rates, with blue indicating the probability distribution and a red line indicating the ground truth used for simulation. The right column shows inferred posteriors over unbinding rates, with blue indicating the probability distribution and red lines indicating ground truth values used for simulation. The parameters used in simulation are specified in main text and table SI4.
Figure 8:
Figure 8:
Data from DNA origami binding experiments. The left column shows example traces from our experiments. The top two rows of the left column show example traces from data with one binding site, the middle two rows of the left column show example traces from data with two binding sites, and the bottom two rows of the left column show traces from data with five binding sties. The middle column shows inferred posteriors over binding rates. The right column shows inferred posteriors over unbinding rates. Data from 126, 393 and 353 traces were analyzed for the one, two and five binding site samples, respectively.

References

    1. Debnath Sibali and Raghavachari Krishnan. “Investigating the Stacking Interactions Responsible for Driving 3D Self-Association of Tricarb Macrocycles”. In: The Journal of Physical Chemistry A 127.39 (2023), pp. 8110–8116. - PubMed
    1. German Helen W, Uyaver Sahin, and Hansmann Ulrich HE. “Self-assembly of phenylalanine-based molecules”. In: The Journal of Physical Chemistry A 119.9 (2014), pp. 1609–1615. - PubMed
    1. Petroski Janet M, Green Travis C, and El-Sayed Mostafa A. “Self-assembly of platinum nanoparticles of various size and shape”. In: The Journal of Physical Chemistry A 105.23 (2001), pp. 5542–5547.
    1. Ma Guangzhong et al. “Quantifying ligand-protein binding kinetics with self-assembled nano-oscillators”. In: Analytical chemistry 91.21 (2019), pp. 14149–14156. - PMC - PubMed
    1. Banerjee Kinshuk, Kolomeisky Anatoly B, and Igoshin Oleg A. “Accuracy of substrate selection by enzymes is controlled by kinetic discrimination”. In: The journal of physical chemistry letters 8.7 (2017), pp. 1552–1556. - PubMed

Publication types

LinkOut - more resources