[Preprint]. 2025 Feb 8:2025.02.03.636352.
doi: 10.1101/2025.02.03.636352.

A Comparative Evaluation of Computational Models for RNA modification detection using Nanopore sequencing with RNA004 Chemistry

Affiliations

A Comparative Evaluation of Computational Models for RNA modification detection using Nanopore sequencing with RNA004 Chemistry

Yongji Zou et al. bioRxiv. .

Update in

Abstract

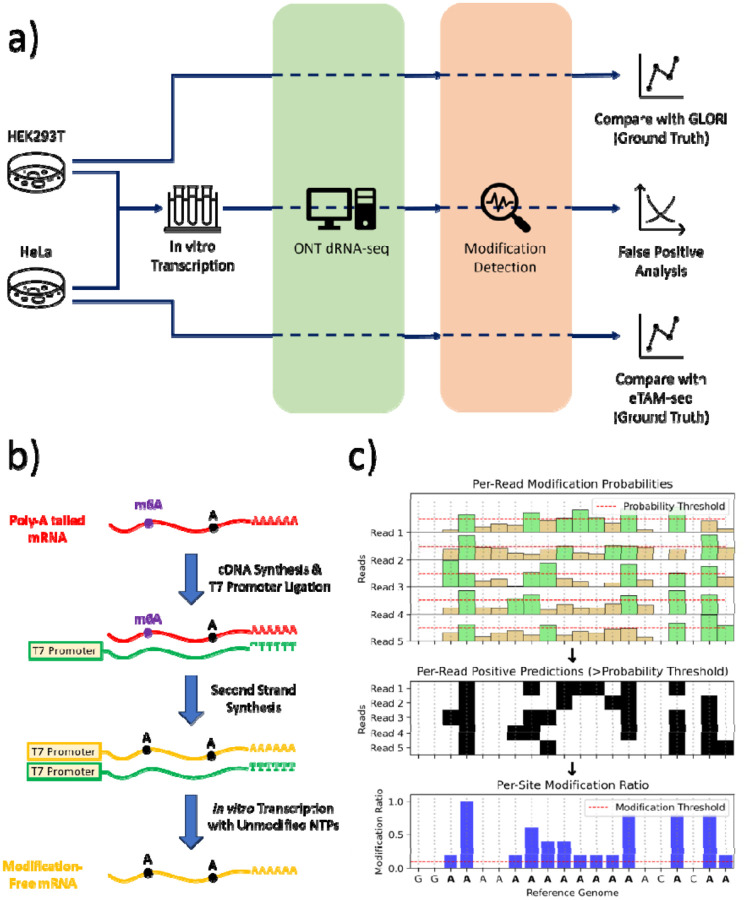
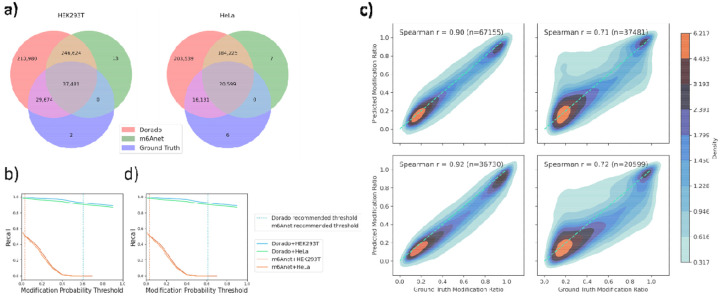
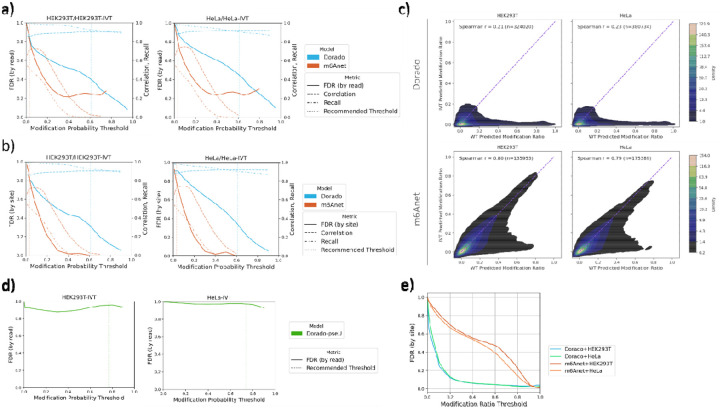
Direct RNA sequencing from Oxford Nanopore Technologies (ONT) has become a valuable method for studying RNA modifications such as N6-methyladenosine (m6A), pseudouridine (ψ), and 5-methylcytosine (m5C). Recent advancements in the RNA004 chemistry substantially reduce sequencing errors compared to previous chemistries (e.g., RNA002), thereby promising enhanced accuracy for epitranscriptomic analysis. In this study, we benchmark the performance of two state-of-the-art RNA modification detection models capable of handling RNA004 data - ONT's Dorado and m6Anet - using two wild-type (WT) cell lines, HEK293T and HeLa, with respective ground truths from GLORI and eTAM-seq, and their paired in vitro transcribed (IVT) RNA as negative controls. We found that under default settings and considering sites with ≥10% modification ratio and ≥10X coverage, Dorado has higher recall (~0.92) than m6Anet (~0.51) for m6A detection. Among the overlapping methylated sites between ground truth and computational predictions, there are high correlations of site-specific m6A modification stoichiometry, with correlation coefficient of ~0.89 for Dorado-truth comparison and ~0.72 for m6Anet-truth comparison. However, combined assessment of WT and IVT datasets show that while the per-site false positive rate (FPR) can be lower (~8% for Dorado and ~33% for m6Anet), both computational tools can have high per-site false discovery rate (FDR) of m6A (~40% for Dorado and ~80% for m6Anet) due to the low prevalence of m6A in transcriptome, with a similar trend observed for pseudouridine (~95% FDR for Dorado). Additional motif analysis reveals that both Dorado and m6Anet exhibit high heterogeneity of false positive calls across sequence contexts, suggesting that sequence contexts help determine accuracy of specific modification calls. There is also a substantial overlap of false positive calls between the two IVT samples, suggesting a post-filtering strategy to improve modification calling by compiling a set of low-confidence sites with a probabilistic model from several IVT samples across diverse cells/tissues. Our analysis highlights key strengths and limitations of the current generation of m6A detection algorithms and offers insights into optimizing thresholds and interpretability. The IVT datasets generated by the RNA004 chemistry provides a publicly available benchmark resource for further development and refinement of computational methods.


Conflict of interest statement

Competing Interests The authors declare no competing interests.

Figures

Figure 1.
Figure 1.. Schematic overview of sample preparation, ONT direct RNA sequencing, and modification detection workflow.
a) Study design. Multiple RNA inputs (cell-extracted poly(A)-tailed mRNA containing m6A, or in vitro transcribed controls without modifications) are processed through Oxford Nanopore’s direct RNA sequencing platform. The resulting signal and basecalls then feed into a modification detection module, which assigns per-read modification probabilities. b) The preparation of cellular m6A-modified mRNA (red), in vitro transcripts (green), and reverse-transcribed unmodified transcripts (yellow). c) Schematic demonstrating how per-read probabilities are filtered by a chosen threshold to produce positive modification calls (green and black), which can then be aggregated into per-site modification ratios across the transcriptome, and further judged by certain threshold (10% in this study) for site-level predictions.
Figure 2:
Figure 2:. m6A detection performance comparisons between Dorado and m6Anet in HEK293T and HeLa datasets.
a) Venn diagrams depicting the overlap among Dorado predictions, m6Anet predictions, and ground truth sites for HEK293T (left) and HeLa (right). Each circle segment denotes the number of exonic DRACH sites predicted by the respective method or ground truth. Note that these sets are the counts of the raw outputs before called for modification. b,d) Per-site recall (left) and modification ratio correlation (right) curves plotted against the modification probability threshold for Dorado (green and blue lines) and m6Anet (red and orange lines) on both HEK293T and HeLa datasets. Vertical dotted lines indicate each model’s recommended threshold, illustrating how recall and correlation vary as the threshold changes, and highlighting the trade-offs each tool makes between sensitivity (recall) and predictive reliability (correlation). c) Density plots illustrating correlations between predicted modification ratios from Dorado (left column) or m6Anet (right column) and the ground truth modification ratios for HEK293T (top row) and HeLa (bottom row). The Spearman correlation coefficients are shown in each panel, along with the total number of sites (n). Dense regions (red) indicate a strong agreement between predicted and ground truth ratios, while lighter areas (blue) reflect lower site densities or greater deviations.
Figure 3:
Figure 3:. Threshold-dependent performance and distribution of predicted m6A probabilities/ratios for Dorado and m6Anet in HeLa and HEK293T datasets.
a) Per-read false positive rate (FPR), with per-site recall, and correlation as functions of the modification probability threshold in HEK293T (left) and HeLa (right) (using IVT control for FPR, WT RNA for correlation and recall). The dotted vertical lines indicate Dorado’s (blue) and m6Anet’s (orange) recommended thresholds. c) Per-site FPR, recall, and correlation under the same settings as a). b) Violin plot showing the distribution of per-read modification probabilities for wild-type and IVT samples (HeLa and HEK293T), with horizontal dotted lines marking each model’s recommended threshold. Notably, Dorado’s predictions display a more pronounced double-peaked structure split at its recommended threshold, while m6Anet’s distributions exhibit a single peak closer to zero. d) Violin plots present the corresponding per-site modification ratio distributions under the same settings as c). e) Per-read false positive rate (FPR) of Dorado’s pseudouridine model, as a function of the modification probability in two cell lines. The dotted vertical lines indicate Dorado’s recommended thresholds.
Figure 4:
Figure 4:. Threshold-dependent false discovery rate (FDR), recall, and correlation analyses for Dorado and m6Anet in HEK293T and HeLa datasets.
a) shows how the per-read FDR (solid lines), and per-site recall (dash-dotted lines) and correlation (dashed lines) change as the modification probability threshold varies for each model. b) presents analogous curves for the per-site FDR. The vertical dotted lines indicate each model’s recommended threshold. FDR calculation at very high threshold is removed to avoid noise effect due to the low absolute number of positive predictions after filtering (>10). c) Comparison of per-site modification ratios in IVT (y-axis) versus WT (x-axis) samples for Dorado (top row) and m6Anet (bottom row) in HEK293T (left column) and HeLa (right column). The Spearman correlation coefficients (r) in each plot quantify the degree of similarity between the IVT and WT predicted modification ratios. Dorado’s correlations (0.18–0.24) indicate limited agreement. By contrast, m6Anet shows substantially stronger IVT–WT correlations (0.79–0.80). d) Per-read false discovery rate (FDR) of Dorado’s pseudouridine model, as a function of the modification probability in two cell lines. The dotted vertical lines indicate Dorado’s recommended thresholds. e) Per site FDR as a function of the modification ratio threshold for Dorado and m6Anet in HEK293T and HeLa datasets. As the threshold increases, sites must exhibit increasingly higher modification ratios before being labeled “modified,” which generally reduces the FDR.
Figure 5:
Figure 5:. Comparison of modification ratio correlations between HEK293T and HeLa in both WT and IVT samples for Dorado (left), m6Anet (middle), and ground truth (right).
In the top row, each hexbin plot shows the per-site modification ratios for HEK293T-WT (x-axis) against HeLa-WT (y-axis); in the bottom row, the ratios for HEK293T-IVT (x-axis) are compared to HeLa-IVT (y-axis). The Spearman correlation coefficients (r) are noted above each panel, along with the number of common sites (n). For Dorado, we observe moderate cross-cell-line correlation in WT samples and lower correlation in IVT. By contrast, m6Anet yields a higher correlation in both WT and IVT, suggesting stronger internal consistency across samples. Ground truth shows the highest correlation. The color scale (right) indicates the log-scale count of sites within each hexbin.
Figure 6:
Figure 6:. Motif-Specific Performance Metrics for Dorado and m6Anet in HEK293T and HeLa.
Each panel displays bar plots of correlation, recall, FPR (per site), FDR (per site), and count (i.e., the number of sites matching each motif) for different 5-mer motifs around the predicted adenines. The top row shows Dorado results in HEK293T (a) and HeLa (b), while the bottom row presents m6Anet results in HEK293T (c) and HeLa (d). As defined earlier, correlation measures how well the predicted modification ratios match the ground truth; recall (sensitivity) is the fraction of truly modified sites correctly identified; FPR is the fraction of unmodified sites (in IVT) misclassified as modified; and FDR is the fraction of predicted positives between IVT and WT (capped at 1). Comparing these metrics across different motifs highlights that sequence contexts greatly influence the accuracy of modification detection.

References

    1. Liu W-W, Zheng S-Q, Li T, Fei Y-F, Wang C, Zhang S, Wang F, Jiang G-M, Wang H: RNA modifications in cellular metabolism: implications for metabolism-targeted therapy and immunotherapy. Signal Transduction and Targeted Therapy 2024, 9(1). - PMC - PubMed
    1. Qiu L, Jing Q, Li Y, Han J: RNA modification: mechanisms and therapeutic targets. Molecular Biomedicine 2023, 4(1). - PMC - PubMed
    1. Delaunay S, Helm M, Frye M: RNA modifications in physiology and disease: towards clinical applications. Nature Reviews Genetics 2024, 25(2):104–122. - PubMed
    1. Xu L, Seki M: Recent advances in the detection of base modifications using the Nanopore sequencer. J Hum Genet 2020, 65(1):25–33. - PMC - PubMed
    1. Alfonzo JD, Brown JA, Byers PH, Cheung VG, Maraia RJ, Ross RL: A call for direct sequencing of full-length RNAs to identify all modifications. Nature Genetics 2021, 53(8):1113–1116. - PubMed

Publication types

LinkOut - more resources