[Preprint]. 2025 Feb 8:2025.02.05.636707.
doi: 10.1101/2025.02.05.636707.

Multi-omic Characterization of HIV Effects at Single Cell Level across Human Brain Regions

Affiliations

Multi-omic Characterization of HIV Effects at Single Cell Level across Human Brain Regions

Junchen Yang et al. bioRxiv. .

Abstract

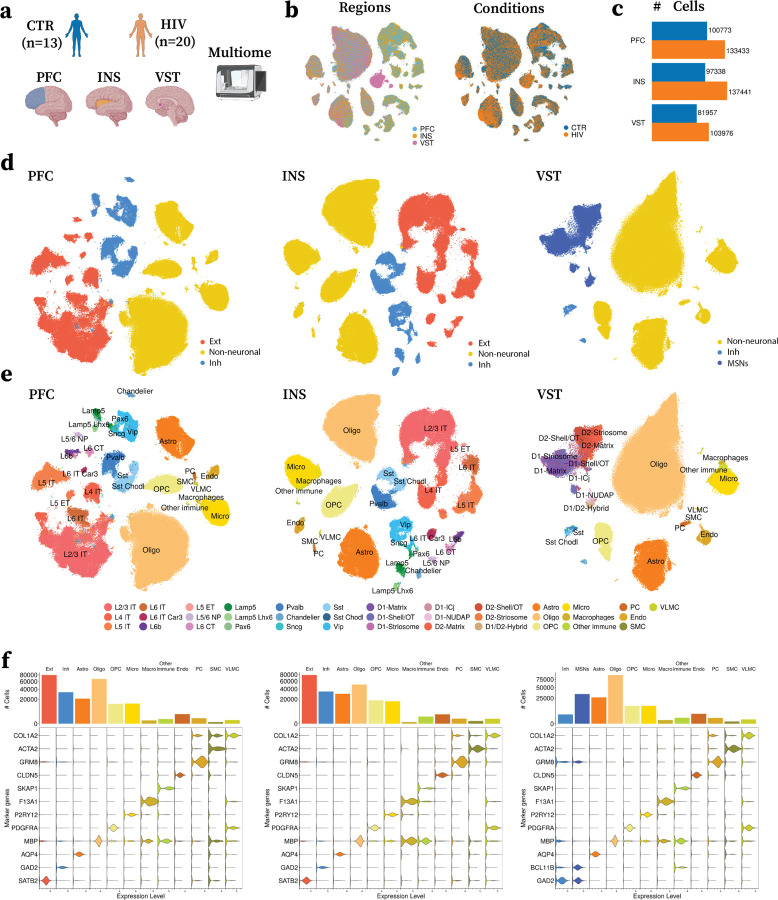
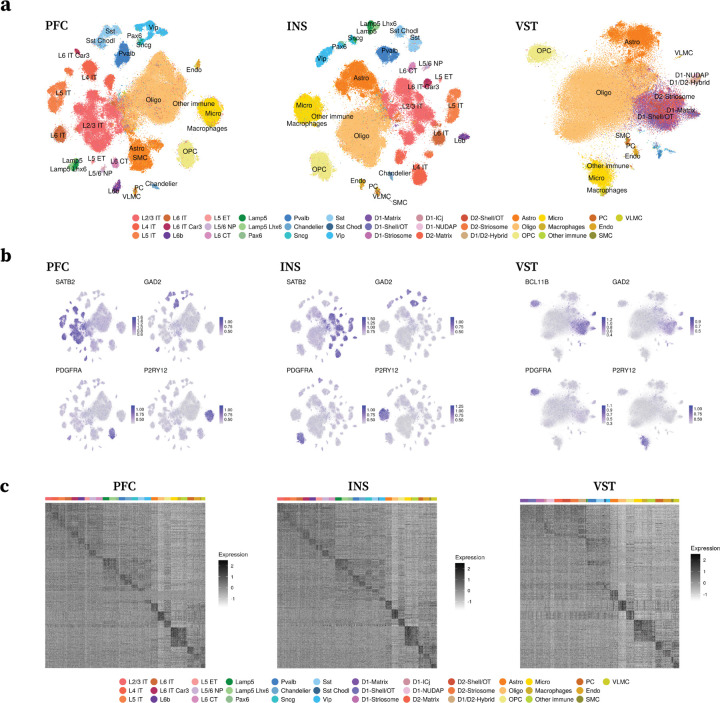
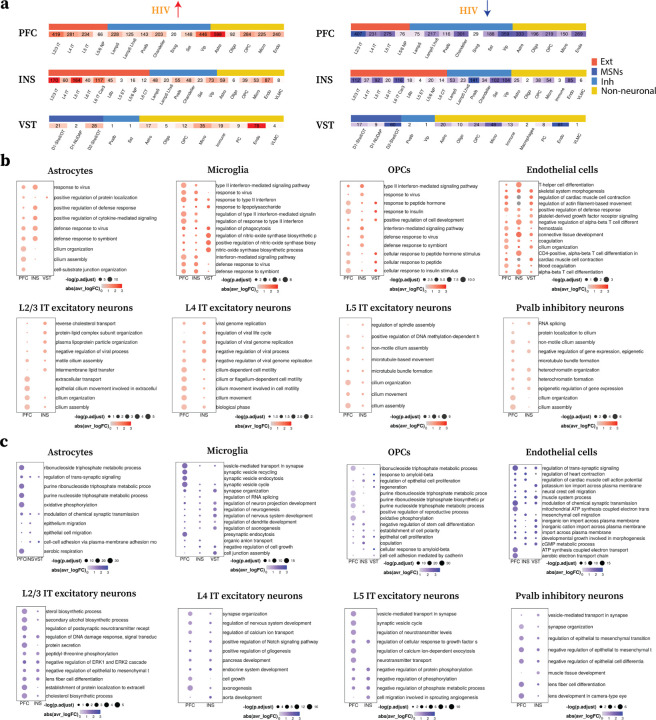
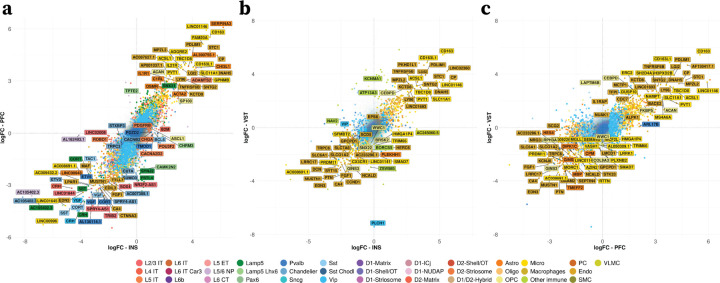
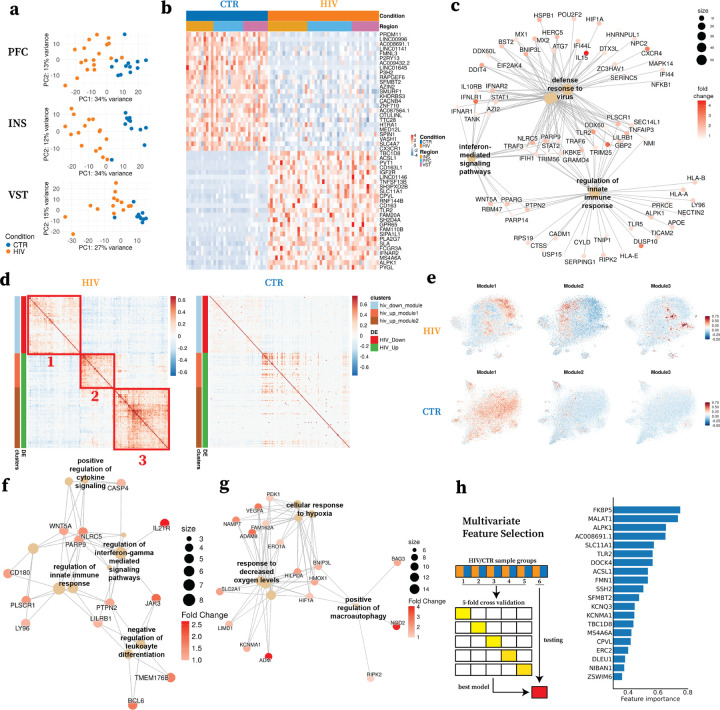
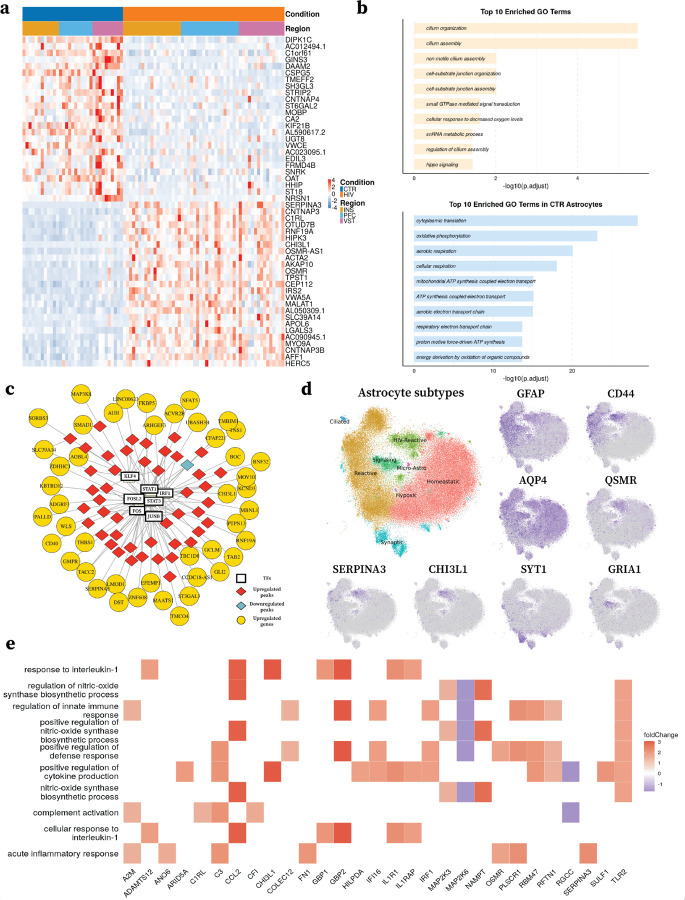
HIV infection exerts profound and long-lasting neurodegenerative effects on the central nervous system (CNS) that can persist despite antiretroviral therapy (ART). Here, we used single-nucleus multiome sequencing to map the transcriptomic and epigenetic landscapes of postmortem human brains from 13 healthy individuals and 20 individuals with HIV who have a history of treatment with ART. Our study spanned three distinct regions-the prefrontal cortex, insular cortex, and ventral striatum-enabling a comprehensive exploration of region-specific and cross-regional perturbations. We found widespread and persistent HIV-associated transcriptional and epigenetic alterations across multiple cell types. Detailed analyses of microglia revealed state changes marked by immune activation and metabolic dysregulation, while integrative multiomic profiling of astrocytes identified multiple subpopulations, including a reactive subpopulation unique to HIV-infected brains. These findings suggest that cells from people with HIV exhibit molecular shifts that may underlie ongoing neuroinflammation and CNS dysfunction. Furthermore, cell-cell communication analyses uncovered dysregulated and pro-inflammatory interactions among glial populations, underscoring the multifaceted and enduring impact of HIV on the brain milieu. Collectively, our comprehensive atlas of HIV-associated brain changes reveals distinct glial cell states with signatures of proinflammatory signaling and metabolic dysregulation, providing a framework for developing targeted therapies for HIV-associated neurological dysfunction.


Figures

Figure 1:
Figure 1:
Single nuclei profiling of HIV effects across different brain regions. a: Overview of the study design. Three brain regions, including prefrontal cortex (PFC), insular cortex (INS), and ventral striatum (VST), are dissected and profiled using 10x Multiome of post-mortem tissue from 20 PWH and 13 CTR. b: t-SNE visualization of the cells in the RNA data after processing, colored by brain regions (left) and conditions (right), respectively. c: Total number of cells grouped by regions and conditions after processing. d-e: t-SNE visualization of the cells after cell annotations. Cells are labeled and colored by the annotated coarse-grained cell types (d) and fine-grained cell types (e) across regions. f : Cell numbers per cell type and marker gene validation of the annotations. Bar plot visualizations (top) show the number of cells per cell type in each region. The stacked violin plots (bottom) show the expression levels of the marker genes (rows) across the cell types (columns). Rows and columns are sorted such that the markers and the cell types are in the same order. Left-to-right, panels correspond to each brain region( PFC, INS, and VST, respectively).
Figure 2:
Figure 2:
Epigenetic characterization of the brain regions. a: t-SNE visualization of the ATAC data for each brain region (PFC, INS, and VST), colored by the cell annotations. b: t-SNE visualization of the gene activities of marker genes in each region. SATB2 - Excitatory neurons, GAD2 - Inhibitory neurons, BCL11B - Medium spiny neurons, PDGFRA - OPC, P2RY12 - Microglia. c: Heatmap visualization of the top active genes (y-axis) across different cell types (axis) for each region. The values are log-normalized gene activity scores.
Figure 3:
Figure 3:
Differential gene expression analysis reveals strong signals associated with HIV. a: Total number of differentially expressed genes (DEGs) in each cell type that are upregulated in HIV (left) and downregulated in HIV (right). The heatmap is splited by regions and colored by the coarse-grained cell types (Ext, MSNs, Inh, Glial). b: Dot plot visualizations of the top upregulated pathways in HIV from each cell type across regions. c: Dot plot visualizations of the top downregulated pathways in HIV from each cell type across regions.
Figure 4:
Figure 4:
Cross-region comparison of differential signals. a-c: Comparison of DEGs and their effect size (logFC) between HIV and CTR for each pair of regions. Genes are colored by the corresponding cell types and the top DEGs are labeled with gene names. a: logFC of the DEGs from INS (x-axis) vs logFC of the DEGs from PFC (y-axis). b: logFC of the DEGs from INS (x-axis) vs logFC of the DEGs from VST (y-axis). c: logFC of the DEGs from PFC (x-axis) vs logFC of the DEGs from VST (y-axis).
Figure 5:
Figure 5:
The effects of HIV on microglia of the INS, PFC, and VST. a: Principal Component Analysis (PCA) visualization of the microglia samples for each region. Each sample is colored by the corresponding condition label. b: Heatmap visualization of the top DEGs of the HIV main effect. Columns are different samples grouped by conditions and regions, and rows are the top DEGs with 25 each in the HIV-upregulated group and HIV-downregulated group. The expression levels inside the heatmap are z-scored for each gene. c: Visualization of top enriched GO pathways for the upregulated DEGs across regions. d: Heatmap visualization of the identified gene modules in HIV samples (Left) compared to the control samples (Right). Rows and columns are DEGs grouped by direction of the differential expression, and values are pair-wise correlation coefficients. Three gene modules are identified via hierarchical clustering (labeled as 1,2, 3). e: t-SNE visualization of HIV microglia (top row) and CTR microglia (bottom row) colored by the gene module scores from each of three identified gene modules (columns). f: Visualization of the top GO pathways associated with gene module 2. g: Visualization of the top GO pathways associated with gene module 3. h: Multivariate feature selection to select most informative genes predicting the conditions. Left: model training schemes. Right: Top selected genes (y-axis) and their feature importance (x-axis) for the best model.
Figure 6:
Figure 6:
Translational and epigenetic changes on astrocytes of INS, PFC, VST due to HIV infection. a: Heatmap visualization of the top DEGs of the HIV main effect. Columns are different samples grouped by conditions and regions, and rows are the top DEGs with 25 each in the HIV-upregulated group and HIV-downregulated group. The expression levels inside the heatmap are z-scored for each gene. b: Top 10 enriched GO terms for the genes upregulated in PWH (top) and the genes downregulated in PWH (bottom) c: Gene regulatory network analysis conducted using MAGICAL for upregulated peaks and genes in PWH. A subset of transcription factors was chosen for visualization. The connections are visualized connecting transcription factors to peak and peaks to genes. d: t-SNE visualization of astrocyte subtypes and the expression levels of the corresponding marker genes. e: Heatmap of GO biological process based pathway analysis of markers of HIV-Reactive astrocytes colored based on log fold change of DEGs based on a wilcoxon test.

Similar articles

References

    1. Ash Michelle K, Al-Harthi Lena, and Schneider Jeffrey R. Hiv in the brain: identifying viral reservoirs and addressing the challenges of an hiv cure. Vaccines, 9(8):867, 2021. - PMC - PubMed
    1. Waight Emiko, Zhang Chen, Mathews Saumi, Kevadiya Bhavesh D, Lloyd KC Kent, Gendelman Howard E, Gorantla Santhi, Poluektova Larisa Y, and Dash Prasanta K. Animal models for studies of hiv-1 brain reservoirs. Journal of Leukocyte Biology, 112(5):1285–1295, 2022. - PMC - PubMed
    1. Hatziioannou Theodora and Evans David T. Animal models for hiv/aids research. Nature Reviews Microbiology, 10(12):852–867, 2012. - PMC - PubMed
    1. Valdebenito Silvana, Castellano Paul, Ajasin David, and Eliseo A Eugenin. Astrocytes are hiv reservoirs in the brain: a cell type with poor hiv infectivity and replication but efficient cell-to-cell viral transfer. Journal of neurochemistry, 158(2):429–443, 2021. - PMC - PubMed
    1. Plaza-Jennings Amara L, Valada Aditi, O’Shea Callan, Iskhakova Marina, Hu Benxia, Javidfar Behnam, Hutta Gabriella Ben, Lambert Tova Y, Murray Jacinta, Kassim Bibi, et al. Hiv integration in the human brain is linked to microglial activation and 3d genome remodeling. Molecular cell, 82(24):4647–4663, 2022. - PMC - PubMed

Publication types

LinkOut - more resources