[Preprint]. 2025 Feb 8:2025.02.05.636743.
doi: 10.1101/2025.02.05.636743.

Chronic alcohol consumption enhances the differentiation capacity of hematopoietic stem and progenitor cells into osteoclast precursors

Affiliations

Chronic alcohol consumption enhances the differentiation capacity of hematopoietic stem and progenitor cells into osteoclast precursors

Hami Hemati et al. bioRxiv. .

Update in

Abstract

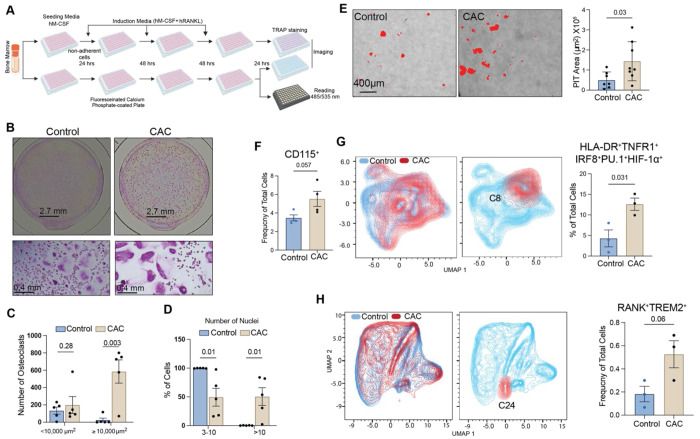
Chronic alcohol consumption (CAC) is associated with an enhanced risk of bone fracture, reduced bone density, and osteoporosis. We have previously shown using a rhesus macaque model of voluntary ethanol consumption that CAC induces functional, transcriptomic, and epigenomic changes in hematopoietic stem and progenitor cells (HSPCs) and their resultant monocytes/macrophages, skewing them towards a hyper-inflammatory response. Here, we extended those studies and investigated alterations in osteoclasts, which, in postnatal life, are differentiated from HSPCs and play a critical role in maintaining bone homeostasis. Analysis using spectral flow cytometry revealed a skewing of HSPCs towards granulocyte-monocyte progenitors (GMPs) with the CAC group that was in concordance with an increased number of colony-forming unit-granulocyte/macrophage (CFU-GM). Additionally, HSPCs from animals in the CAC group incubated with M-CSF and RANKL were more likely to differentiate into osteoclasts, as evidenced by increased Tartrate-Resistant Acid Phosphatase (TRAP) staining and bone resorption activity. Moreover, single-cell RNA sequencing of differentiated HSPCs identified three clusters of osteoclast precursors in the CAC group with enhanced gene expression in pathways associated with cellular response to stimuli, membrane trafficking, and vesicle-mediated transport. Collectively, these data show that CAC-derived hematopoietic progenitor cells exhibit a higher capacity to differentiate into osteoclast precursors. These findings provide critical insights for future research on the mechanisms by which CAC disrupts monopoiesis homeostasis and enhances osteoclast precursors, thereby contributing to reduced bone density.

Keywords: Chronic alcohol consumption; Hematopoietic stem and progenitor cells; Osteoclast; Osteoclast precursors; Osteoclastogenesis; Osteoporosis.


Conflict of interest statement

Conflict of interest The authors declare no conflict of interest.

Figures

Figure 1-
Figure 1-. CAC increases the differentiation capacity of HSPCs into granulocyte-macrophage progenitors.
A) Experimental design. B) Representative images of CFU-GM colonies and colony counts. C) The percentage of cMoP and GMP cells among their parent population. D) The percentage of CD64+ among CD14CD34+ and Lin-CD38+CD34+CD123+CD45RA+. E) Percentage of CD14+ cells among GMPs and F) CD123+ cells among CD14CD34+ cells. Error bars for all graphs are defined as ± standard error of the mean (SEM), and each dot corresponds to an individual animal.
Figure 2-
Figure 2-. CAC depletes HSCs while enhancing GMPs.
A) Frequencies of GMPs and cMoPs within LinCD38+CD34+CD123+CD45RA+ cells. B) Mean fluorescence intensity (MFI) of key hematopoietic markers; * indicates p≤0.05, and # indicates 0.05≤p≤0.1. C) UMAP depicts the clusters within the control and CAC groups. D) Contribution of control and CAC group in PoP1 and PoP26. E) The PoP1 and PoP26 of unsupervised analysis and monocytes, GMP, and HSC population of supervised analysis were mapped on the PHATE plot. Links between clusters were drawn manually. F) PoP1 and PoP26 overlapped on the gating strategy used for supervised analysis. Error bars for all graphs are defined as ± Standard deviation (SD).
Figure 3-
Figure 3-. CAC enhances the number and size of osteoclasts.
A) Experimental design to assess the impact of CAC on osteoclastogenesis. B) Representative images of differentiated osteoclasts are provided at 4X and 10X. Osteoclasts were classified according to their C) size and D) number of nuclei per cell. E) Representative images (4X) of the pit area following differentiation of bone marrow cells on calcium-coated plates. F) The frequency of CD115+ bone marrow cells in the experiment presented in Fig.2. G) Dimensional reduction analysis of the CD115+CD14+ population showing the frequency of C8. H) Dimensional reduction analysis showing the frequency of Cluster 24 (RANK+TREM2+). Data represent mean values ± SEM.
Figure 4-
Figure 4-. Single-cell RNA-sequencing reveals CAC-mediated transcriptome changes in osteoclasts.
A) UMAP after dimension reduction of 15,445 cells representing control and CAC cells and identified clusters. B) A shortlist of gene markers that was utilized to identify clusters. C) Percentage of each group contributing to each cluster. D) UMAP clustering with Slingshot lineage projection lines. E) Expression levels of selected DEGs in specified clusters. F) Functional enrichment of genes upregulated with CAC in “differentiating macrophage”, “osteoclast precursor”, and osteoclast” clusters using Reactome. The size of the bubbles represents the number of genes associated with each GO term, and the bubble color indicates the statistical significance of the enrichment of a GO term based on the −log10 of the p-value.
Figure 5-
Figure 5-. Osteoclastogenesis induced by CAC impacts myeloid production.
A) Experimental design used to perform the CFU-GM assay using conditioned media obtained from osteoclast cultures of control and CAC groups. B) The number of CFU-GM colonies. C) The ratio of LinCD38+CD34+CD123+CD45RA+ among the CD34+CD38+ in CFU-GM assay. D) Experimental design to perform EdU assay. E) The frequency of cMoP EdU+ and HLADR+CD14+EdU+ in cultures incubated with osteoclast-conditioned media. F) Levels of IL-6 and PDGF-BB measured in supernatants of the osteoclasts culture. Data represent mean values ± SEM

References

    1. SAMHSA CfBHSaQ. National Survey on Drug Use and Health. 2022. [cited 2024 December 18, 2023]. Available from: https://www.samhsa.gov/data/sites/default/files/reports/rpt42728/NSDUHDe....
    1. Maurel DB, Boisseau N, Benhamou CL, Jaffre C. Alcohol and bone: review of dose effects and mechanisms. Osteoporos Int. 2012;23(1):1–16. Epub 20110917. doi: 10.1007/s00198-011-1787-7. - DOI - PubMed
    1. Godos J, Giampieri F, Chisari E, Micek A, Paladino N, Forbes-Hernandez TY, Quiles JL, Battino M, La Vignera S, Musumeci G, Grosso G. Alcohol Consumption, Bone Mineral Density, and Risk of Osteoporotic Fractures: A Dose-Response Meta-Analysis. Int J Environ Res Public Health. 2022;19(3). Epub 20220128. doi: 10.3390/ijerph19031515. - DOI - PMC - PubMed
    1. Chakkalakal DA. Alcohol-induced bone loss and deficient bone repair. Alcohol Clin Exp Res. 2005;29(12):2077–90. doi: 10.1097/01.alc.0000192039.21305.55. - DOI - PubMed
    1. Cheraghi Z, Doosti-Irani A, Almasi-Hashiani A, Baigi V, Mansournia N, Etminan M, Mansournia MA. The effect of alcohol on osteoporosis: A systematic review and meta-analysis. Drug Alcohol Depend. 2019;197:197–202. Epub 20190227. doi: 10.1016/j.drugalcdep.2019.01.025. - DOI - PubMed

Publication types