

This is a preprint.
SpaIM: Single-cell Spatial Transcriptomics Imputation via Style Transfer
- PMID: 39975319
- PMCID: PMC11838188
- DOI: 10.1101/2025.01.24.634756
SpaIM: Single-cell Spatial Transcriptomics Imputation via Style Transfer
Abstract
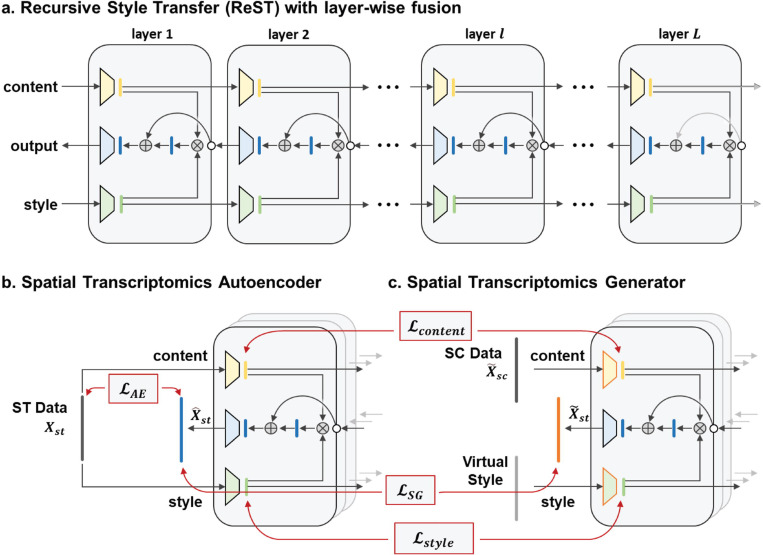
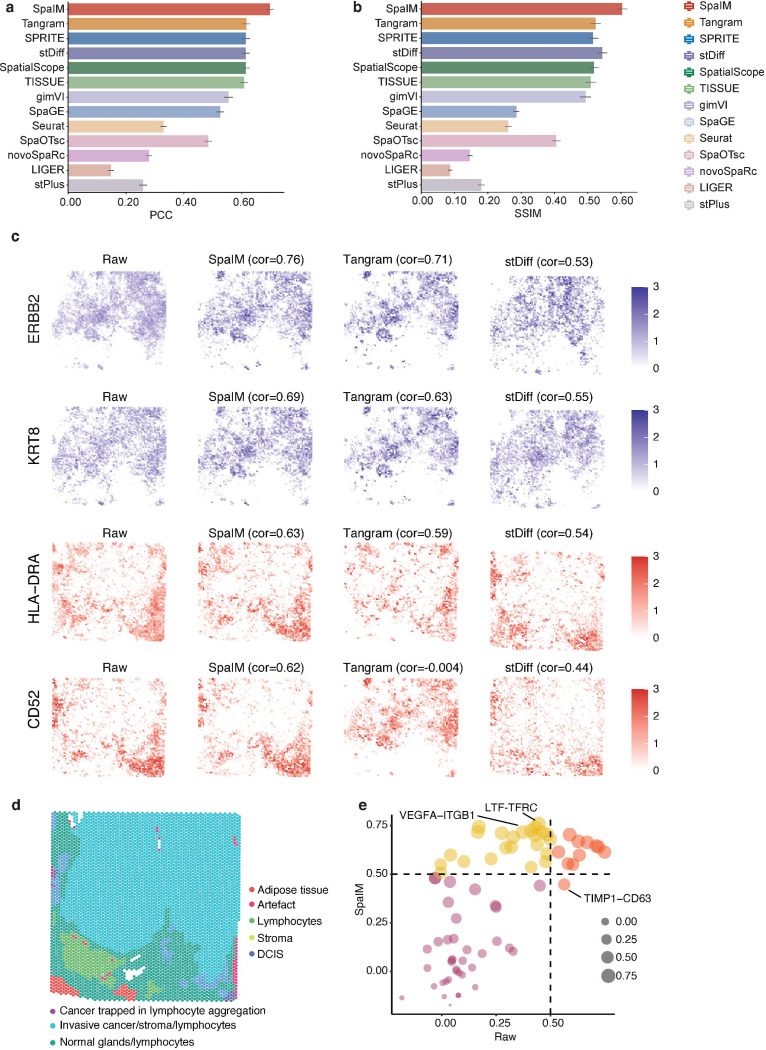
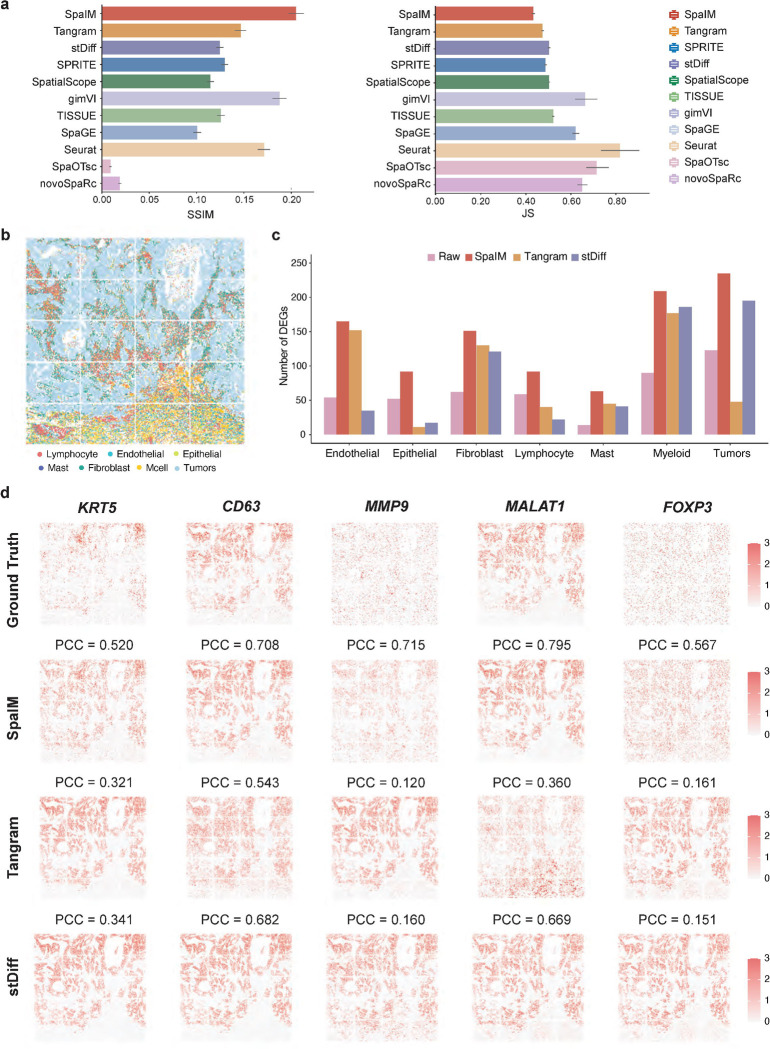
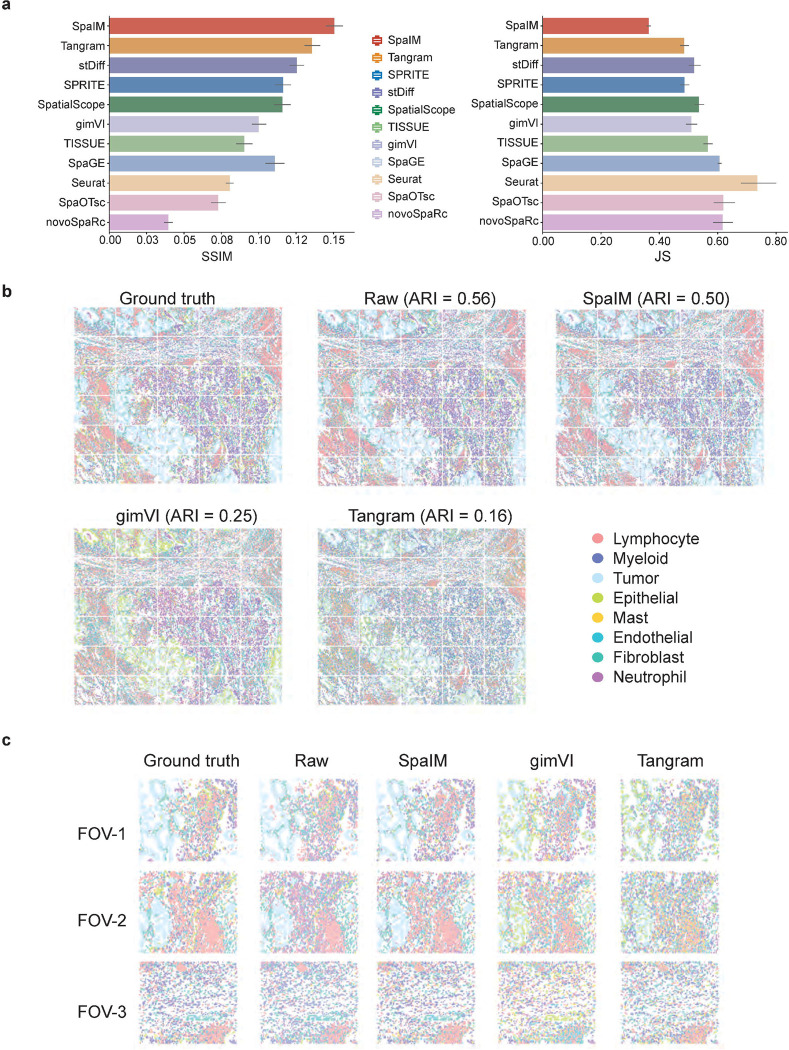
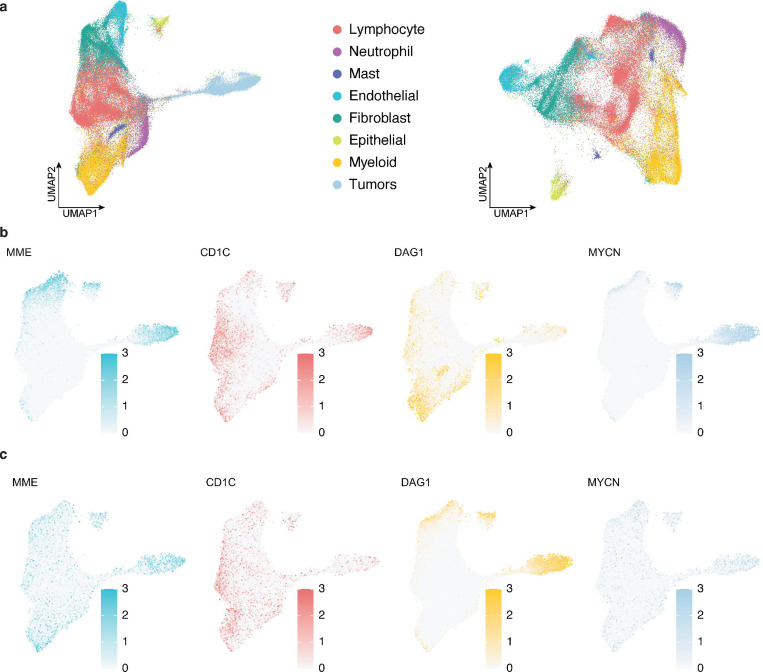
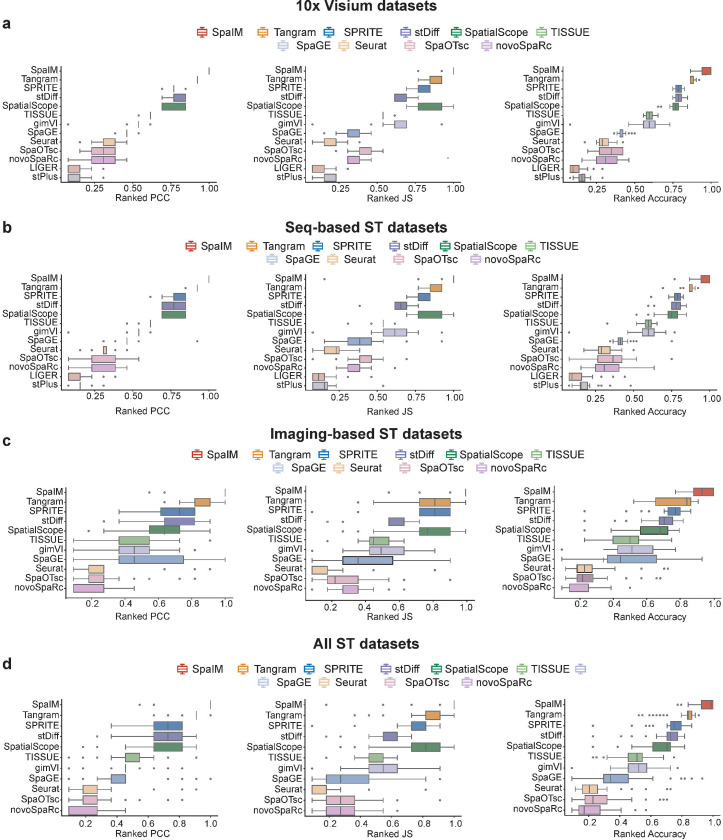
Spatial transcriptomics (ST) technologies have revolutionized our understanding of cellular ecosystems. However, these technologies face challenges such as sparse gene signals and limited gene detection capacities, which hinder their ability to fully capture comprehensive spatial gene expression profiles. To address these limitations, we propose leveraging single-cell RNA sequencing (scRNA-seq), which provides comprehensive gene expression data but lacks spatial context, to enrich ST profiles. Herein, we introduce SpaIM, an innovative style transfer learning model that utilizes scRNA-seq information to predict unmeasured gene expressions in ST data, thereby improving gene coverage and expressions. SpaIM segregates scRNA-seq and ST data into data-agnostic contents and data-specific styles, with the contents capture the commonalities between the two data types, while the styles highlight their unique differences. By integrating the strengths of scRNA-seq and ST, SpaIM overcomes data sparsity and limited gene coverage issues, making significant advancements over 12 existing methods. This improvement is demonstrated across 53 diverse ST datasets, spanning sequencing- and imaging-based spatial technologies in various tissue types. Additionally, SpaIM enhances downstream analyses, including the detection of ligand-receptor interactions, spatial domain characterization, and identification of differentially expressed genes. Released as open-source software, SpaIM increases accessibility for spatial transcriptomics analysis. In summary, SpaIM represents a pioneering approach to enrich spatial transcriptomics using scRNA-seq data, enabling precise gene expression imputation and advancing the field of spatial transcriptomics research.
Conflict of interest statement
COMPETING INTERESTS The authors declare no competing interests.
Figures
Similar articles
-
Computational solutions for spatial transcriptomics.Comput Struct Biotechnol J. 2022 Sep 1;20:4870-4884. doi: 10.1016/j.csbj.2022.08.043. eCollection 2022. Comput Struct Biotechnol J. 2022. PMID: 36147664 Free PMC article. Review.
-
stDiff: a diffusion model for imputing spatial transcriptomics through single-cell transcriptomics.Brief Bioinform. 2024 Mar 27;25(3):bbae171. doi: 10.1093/bib/bbae171. Brief Bioinform. 2024. PMID: 38628114 Free PMC article.
-
Adjustment of scRNA-seq data to improve cell-type decomposition of spatial transcriptomics.Brief Bioinform. 2024 Jan 22;25(2):bbae063. doi: 10.1093/bib/bbae063. Brief Bioinform. 2024. PMID: 38426323 Free PMC article.
-
SpaDiT: diffusion transformer for spatial gene expression prediction using scRNA-seq.Brief Bioinform. 2024 Sep 23;25(6):bbae571. doi: 10.1093/bib/bbae571. Brief Bioinform. 2024. PMID: 39508444 Free PMC article.
-
Unveiling the spatiotemporal strategies of plants in response to biotic and abiotic stresses:A comprehensive review.Plant Physiol Biochem. 2025 Jul;224:109967. doi: 10.1016/j.plaphy.2025.109967. Epub 2025 Apr 29. Plant Physiol Biochem. 2025. PMID: 40315636 Review.
References
-
- Giacomello S. et al. Spatially resolved transcriptome profiling in model plant species. Nature Plants 3, 17061 (2017). - PubMed
-
- Thrane K., Eriksson H., Maaskola J., Hansson J. & Lundeberg J. Spatially resolved transcriptomics enables dissection of genetic heterogeneity in stage III cutaneous malignant melanoma. Cancer research 78, 5970–5979 (2018). - PubMed
-
- Asp M. et al. A Spatiotemporal Organ-Wide Gene Expression and Cell Atlas of the Developing Human Heart. Cell 179, 1647–1660.e1619 (2019). - PubMed
Publication types
Grants and funding
LinkOut - more resources
Full Text Sources