[Preprint]. 2025 Jan 28:2025.01.27.635090.
doi: 10.1101/2025.01.27.635090.

Nemo-like kinase disrupts nuclear import and drives TDP43 mislocalization in ALS

Affiliations

Nemo-like kinase disrupts nuclear import and drives TDP43 mislocalization in ALS

Michael E Bekier 2nd et al. bioRxiv. .

Update in

  • Nemo-like kinase disrupts nuclear import and drives TDP43 mislocalization in ALS.
    Bekier ME 2nd, Pinarbasi E, Krishnan G, Mesojedec JJ, Hurley M, Harikumar Sheela H, Collins CA, Ghaffari L, de Majo M, Ullian EM, Koontz M, Coleman S, Li X, Tank EM, Waksmacki J, Gao FB, Barmada SJ. Bekier ME 2nd, et al. J Clin Invest. 2025 Jun 24;135(17):e188138. doi: 10.1172/JCI188138. eCollection 2025 Sep 2. J Clin Invest. 2025. PMID: 40553568 Free PMC article.

Abstract

Cytoplasmic TDP43 mislocalization and aggregation are pathological hallmarks of amyotrophic lateral sclerosis (ALS). However, the initial cellular insults that lead to TDP43 mislocalization remain unclear. In this study, we demonstrate that Nemo-like kinase (NLK)-a proline-directed serine/threonine kinase-promotes the mislocalization of TDP43 and other RNA-binding proteins by disrupting nuclear import. NLK levels are selectively elevated in neurons exhibiting TDP43 mislocalization in ALS patient tissues, while genetic reduction of NLK reduces toxicity in human neuron models of ALS. Our findings suggest that NLK is a promising therapeutic target for neurodegenerative diseases.


Conflict of interest statement

S.J.B. serves on the advisory board for Neurocures, Inc., Symbiosis, Eikonizo Therapeutics, 15 Ninesquare Therapeutics, the Live Like Lou Foundation, Synapticure, and the Robert Packard Center for ALS Research. S.J.B. has received research funding from Denali Therapeutics, Biogen, Inc., Lysoway Therapeutics, Amylyx Therapeutics, Acelot Therapeutics, Meira GTX, Inc., Prevail Therapeutics, Eikonizo Therapeutics, and Ninesquare Therapeutics.

Figures
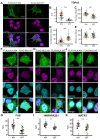
Figure 1.
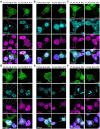
Figure 1.. Overexpression of NLK leads to cytoplasmic accumulation of TDP43 and ALS-FTD relevant RNA-binding proteins.
(A) HEK cells were transfected with plasmids encoding either FLAG-NLK KN (KN; kinase-negative) or FLAG-NLK WT (WT; wild-type) followed by immunofluorescence using antibodies against FLAG and TDP4343 while DNA was stained with Hoechst. Scale bar = 10μm. (B) Superplot of Nuclear-Cytoplasmic ratio (N/C) of TDP43 from images in (A). Line = mean, error bar = standard error. *p<0.05, ** p<0.01, ***p<0.001. (unpaired T-test with Welch’s correction). (C) Superplot of TDP43 nuclear intensity in cells that overexpress KN or WT NLK. Line = mean, error bar = standard error. (D) Superplot of TDP43 cytoplasmic intensity in cells that overexpress KN or WT NLK. Line = mean, error bar = standard error. (E) Superplot quantification of TDP43 whole-cell intensity in cells that overexpress KN or WT NLK. Line = mean, error bar = standard error. (F) HEK cells were transfected with the indicated FLAG-NLK plasmids as in (A) followed by immunofluorescence using antibodies against FLAG, TDP43, and FUS while DNA was stained with Hoechst. Scale bar = 10μm (G) Superplot of FUS localization in cells that overexpress KN or WT NLK. Line = mean, error bar = standard error. (H) HEK cells were transfected with the indicated FLAG-NLK plasmids as in (A) followed by immunofluorescence using antibodies against FLAG, TDP43, and HNRNPA2B1 while DNA was stained with Hoechst. Scale bar = 10μm. (I) Superplot of HNRNPA2B1 localization in cells that overexpress KN or WT NLK. Line = mean, error bar = standard error. (J) HEK cells were transfected with the indicated FLAG-NLK plasmids as in (A) followed by immunofluorescence using antibodies against FLAG, TDP43, and MATR3 while DNA was stained with Hoechst. Scale bar = 10μm. (K) HEK cells were transfected with the indicated FLAG-NLK plasmids as in (A) followed by immunofluorescence using antibodies against FLAG and MART3 while DNA was stained with Hoechst. Scale bar = 10μm. (L) Superplot of HNRNPA2B1 localization in cells that overexpress KN or WT NLK. Line = mean, error bar = standard error.
Figure 2.
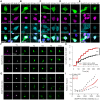
Figure 2.. NLK overexpression disrupts NLS dependent nuclear import.
(A-D) HEK cells were co-transfected with plasmids encoding either FLAG-NLK KN or FLAG-NLK WT and either of the following NLS-reporter eYFP-NLSTDP43 (A), eYFP-NLSFUS (B), eYFP-NLSMATR3 (C), or eYFP-NLSSV40. Schematics created in BioRender. (D). Immunofluorescence was performed using antibodies against FLAG and either TDP43, FUS, or Matrin-3 while DNA was stained with Hoechst. Scale bar 10 uM. (E-H) Superplot of NLS-reporter Nuclear-Cytoplasmic ratio (N/C) from images in A-D. Line = mean, error bar= standard error. *** indicates p-value < 0.001 (unpaired t-test with Welch’s correction).
Figure 3.
Figure 3.. NLK-dependent mislocalization of TDP43 does not depend on nuclear accumulation of KPNA2 and KPNB1.
(A) HEK cells were transfected with plasmids encoding either FLAG-NLK KN (KN; kinase-negative) or FLAG-NLK WT (WT; wild-type) followed by immunofluorescence using antibodies against FLAG, TDP43, and KPNA2 or KPNB1 while DNA was stained with Hoechst. Scale bar = 5μm. (B) Quantification of KPNA2 and KPNB1 localization in cells that overexpress NLK KN or WT. Line = mean, error bar = standard error. Statistical significance indicated as such in all sub-panels: n.s. = not significant, *p<0.05, ** p<0.01, ***p<0.001(unpaired t-test with Welch’s correction).(C) HEK cells were co- transfected with plasmids encoding FLAG-NLK WT and either mApple (negative-control) or V5-FBXW7 followed by immunofluorescence using antibodies against KPNA2, FLAG, and V5 while DNA was stained with Hoechst. Scale bar = 20μm. (D) Quantification of KPNA2 localization in cells that overexpress FLAG-NLK WT and either mApple or V5-FBXW7. Line= mean, error bar= standard error. *p<0.05, ** p<0.01, ***p<0.001 (unpaired t-test with Welch’s correction). (E) HEK cells were co-transfected with plasmids encoding FLAG-NLK WT and either mApple or V5-FBXW7 followed by immunofluorescence using antibodies against TDP43, FLAG, and V5 while DNA was stained with Hoechst. Scale bar = 20μm. (F) Quantification of TDP43 localization in cells that overexpress FLAG-NLK WT and either mApple or V5-FBXW7. Line = mean, error bar= standard error. *p<0.05, ** p<0.01, ***p<0.001 (unpaired t-test with Welch’s correction). (G) HEK cells were co-transfected as in E) followed by immunofluorescence using antibodies against KPNA2, FLAG, and V5 while DNA was stained with Hoescht. Scale bar = 20 μm.(H) HEK cells were co- transfected as in E) followed by immunofluorescence using antibodies against KPNA2, FLAG, and V5 while DNA was stained with Hoechst. Scale bar = 20μm. (I) Quantification of KPNB1 localization in cells that overexpress NLK WT and either mApple orr V5-FBXW7. Line = mean, error bar = standard error.
Figure 4.
Figure 4.. NLK overexpression mislocalizes RanBP2-RanGAP1 and disrupts the Ran gradient.
(A) Representative western blots from HEK cells transfected with either vector (−) or FLAG-NLK WT (WT, +; wild-type). #’s to the left represent molecular weight in kDa. (B) Western blots after immunoprecipitation (IP) using 1μg of the indicated antibodies in 1mg of lysates from (A). (C) Western blots after RanBP2 co-IP from lysates in (A) were run on a 4–20% tris-glycine gel to facilitate visualization of RanBP2 and validate NLK complex formation with RanBP2-RanGAP1-SUMO. (D) HEK cells were transfected with plasmids encoding either FLAG-NLK KN (KN; kinase-negative) or FLAG-NLK WT (WT; wild-type) followed by immunofluorescence using antibodies against FLAG, TDP43, and either Ran, RanGAP1, RanBP2, or MAb414 (FG-nucleoporins) while DNA was stained with Hoechst. Scale bar = 10μm. (E) Superplot of nuclear-cytoplasmic ratio (N/C) of Ran. Line = mean, error bar= standard error. Statistical significance indicated as such in all sub-panels: n.s. = not significant, *p<0.05, ** p<0.01, ***p<0.001. *p<0.05, ** p<0.01, ***p<0.001 (unpaired t-test with Welch’s correction). (F) HEK cells were transfected as in (D) followed by immunofluorescence using antibodies against FLAG, TDP43, and RANBP2 while DNA was stained with Hoechst. Scale bar = 10μm. (G) Superplot of nuclear-rim-cytoplasm ratio (Nuc. Rim/Cyto) of RANBP2. (H) HEK cells were transfected as in (D) followed by immunofluorescence using antibodies against FLAG, TDP43, and MAB414 (FG-nucleoporins) while DNA was stained with Hoechst. Scale bar = 10μm. (I) Superplot of nuclear-rim-cytoplasm ratio (Nuc. Rim/Cyto) of MAB414. (J) HEK cells were transfected as in (D) followed by immunofluorescence using antibodies against FLAG, TDP43, and RAN while DNA was stained with Hoechst. Scale bar = 10μm. (K) Superplot quantification of nuclear-cytoplasm ratio (N/C) of RAN.
Figure 5.
Figure 5.. NLK overexpression drives dissolution of nuclear speckles.
(A) HEK cells were co-transfected with plasmids encoding either FLAG-NLK KN or FLAG-NLK WT and a GFP-tagged RNA-binding mutant TDP43 (TDP43 F147/9L; F2L) followed by immunofluorescence using antibodies against FLAG and FUS and direct visualization of tagged protein while DNA was stained with Hoechst. Scale bar 10 μm. (B) HEK cells were transfected with plasmids encoding either FLAG-NLK KN or FLAG-NLK WT followed by immunofluorescence using antibodies against FLAG, TDP43, and NXF1. Scale bar 10 μm. (C) HEK cells were transfected with plasmids encoding either FLAG-NLK KN or FLAG-NLK WT followed by polyA FISH and immunofluorescence for TDP43. Scale bar 10 μm. (D-F) HEK cells were transfected with plasmids encoding either FLAG-NLK KN or FLAG-NLK WT followed by immunofluorescence for TDP43 and markers of speckles (SC-35) (D), paraspeckles (SFPQ) (E), or nucleolus (nucleophosmin, Npm) (F). Scale bar 10 μm.
Figure 6.
Figure 6.. NLK overexpression disrupts nuclear import and is toxic in primary rat neurons.
(A) Rodent primary cortical neurons were transfected with either SNAP-FLAG (SF; negative-control) or SNAP-FLAG-NLK (SF-NLK) followed by immunofluorescence using antibodies against FLAG and either TDP43, FUS, Ran, RanBP2, RanGAP1, and Mab414 while DNA was stained with Hoechst.Scale bar = 10 μm. (B) Rodent primary cortical neurons were co-transfected with plasmids encoding either SF or SF-NLK and EGFP (survival marker), treated with SNAP-647 dye at T1 to visualize SNAP-positive neurons, and tracked by longitudinal microscopy to determine neuron fate (see methods). Scale bar = 20μm. (C) Cumulative Hazard plot showing the relative risk of death in neurons that express either SF or SF-NLK. Hazard ratio = 1.616. ***p=1.494e-59. (D) Cox proportional hazards model predicting relative hazard associated with different intensities of SNAP-FLAG-NLK. Solid lines indicate the estimated hazard, with color gradients corresponding to intensity levels: grey (low intensity), light red (medium intensity), and red (high intensity). Dashed lines represent 95% confidence intervals for hazard estimates.
Figure 7.
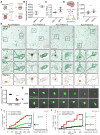
Figure 7.. TDP43 pathology is associated with NLK overexpression in human model systems and patient samples.
(A) Schematic of generation of mbOrgs. (B) Normalized NLK counts from RNASeq performed on WT or GRN−/− mbOrgs. Line = mean, error bar = standard deviation. ** p< 0.01 (unpaired t-test with Welch’s correction). (C) QPCR was performed on WT or GRN−/− mbOrgs (2 biological replicates, 3 technical replicates). Superplot of NLK levels normalized to GAPDH. Line = mean, error bar = standard deviation. * p<0.05 (unpaired t-test with Welch’s correction). (D) NLK normalized counts from RNAseq performed on TDP positive and negative nuclei. Line = mean, error bar = standard deviation. **** p<0.001 (Wald tests, corrected for multiple testing using the Benjamini–Hochberg method). (E) Dual immunohistochemistry for NLK and TDP43, performed on spinal cord tissue from four patients with sporadic ALS. Images deconvolved using FIJI. Upper panels: scale bar 100 μm. Lower panels: scale bar 20 μm. (F) Quantitative real-time PCR of NLK mRNA levels in iPSC derived neurons after transduction with lentivirus virus encoding either non-targeting shRNA (shNT) or NLK shRNA (shNLK). Line = mean, error bar = standard error. *** p< 0.001 (unpaired t-test with Welch’s correction). (G) Isogenic (WT) and mutant TDP43 (M337V) iPSC-derived neurons were transduced with virus encoding either non targeting (NT) shRNA or NLK shRNA followed by longitudinal microscopy to track neuron fate (see methods). Scale bar = 20 μm. (H) Cumulative Hazard plot showing the relative risk of death in ND and C9 neurons that express either shNT shRNA or shNLK (HR = 0.4, p<0.001). (I) Cumulative Hazard plot showing the relative risk of death in WT and M337V neurons that express either Scramble shRNA or NLKshRNA. (HR = 0.23, p=0.0013).

References

    1. Brown RH, and Al-Chalabi A. Amyotrophic Lateral Sclerosis. N Engl J Med. 2017;377(16):1602. - PubMed
    1. Tan RH, Ke YD, Ittner LM, and Halliday GM. ALS/FTLD: experimental models and reality. Acta Neuropathol. 2017;133(2):177–96. - PubMed
    1. Neumann M, Sampathu DM, Kwong LK, Truax AC, Micsenyi MC, Chou TT, et al. Ubiquitinated TDP-43 in frontotemporal lobar degeneration and amyotrophic lateral sclerosis. Science. 2006;314(5796):130–3. - PubMed
    1. Alami NH, Smith RB, Carrasco MA, Williams LA, Winborn CS, Han SSW, et al. Axonal transport of TDP-43 mRNA granules is impaired by ALS-causing mutations. Neuron. 2014;81(3):536–43. - PMC - PubMed
    1. Ling JP, Pletnikova O, Troncoso JC, and Wong PC. TDP-43 repression of nonconserved cryptic exons is compromised in ALS-FTD. Science. 2015;349(6248):650–5. - PMC - PubMed

Publication types

LinkOut - more resources