[Preprint]. 2025 Feb 6:2025.02.02.636139.
doi: 10.1101/2025.02.02.636139.

LRRC8A-containing anion channels promote glioblastoma proliferation via a WNK1/mTORC2-dependent mechanism

Affiliations

LRRC8A-containing anion channels promote glioblastoma proliferation via a WNK1/mTORC2-dependent mechanism

Antonio M Fidaleo et al. bioRxiv. .

Abstract

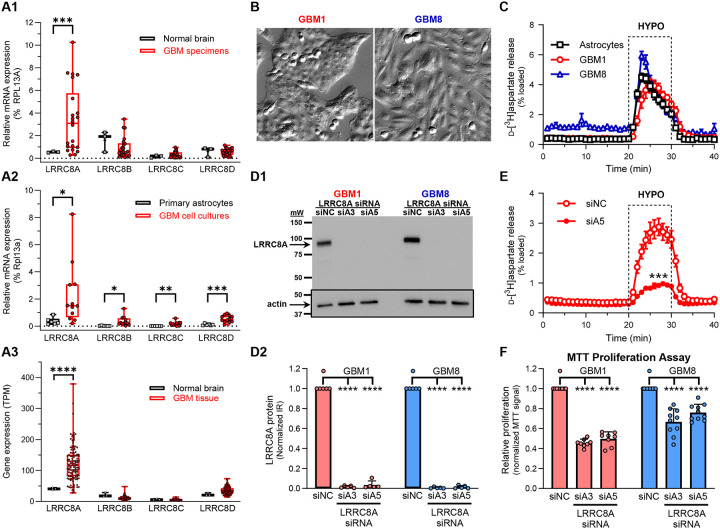
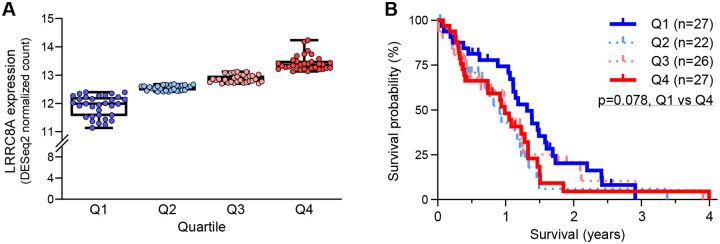
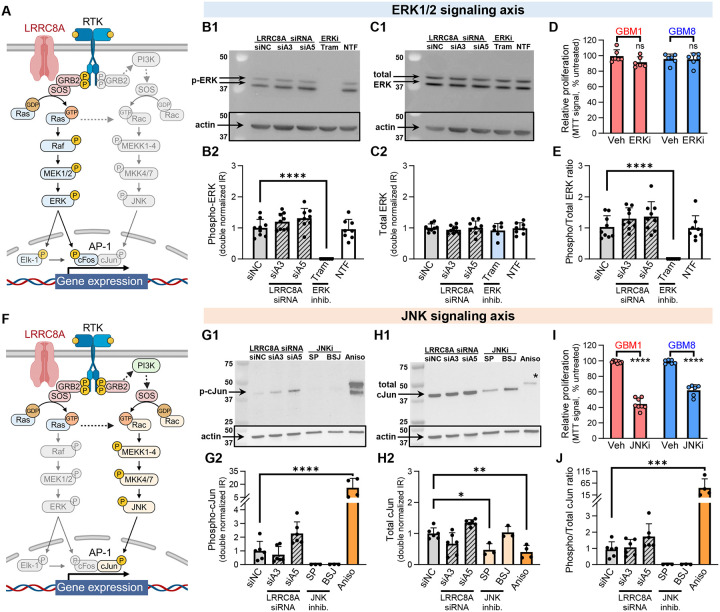
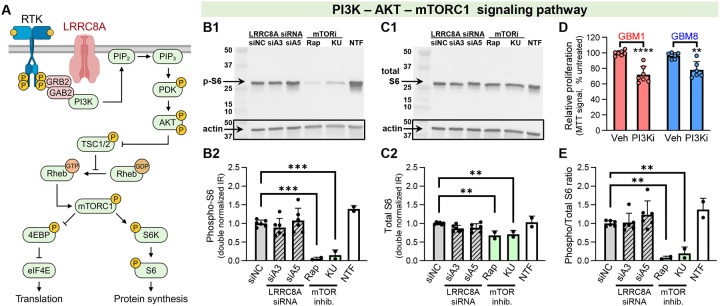
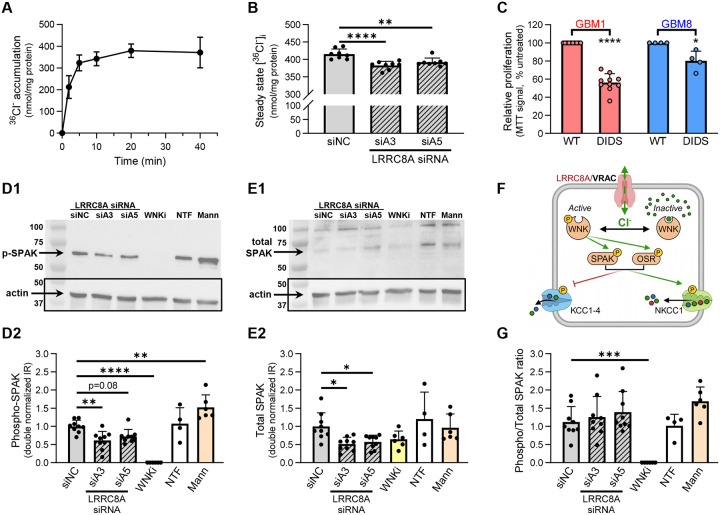
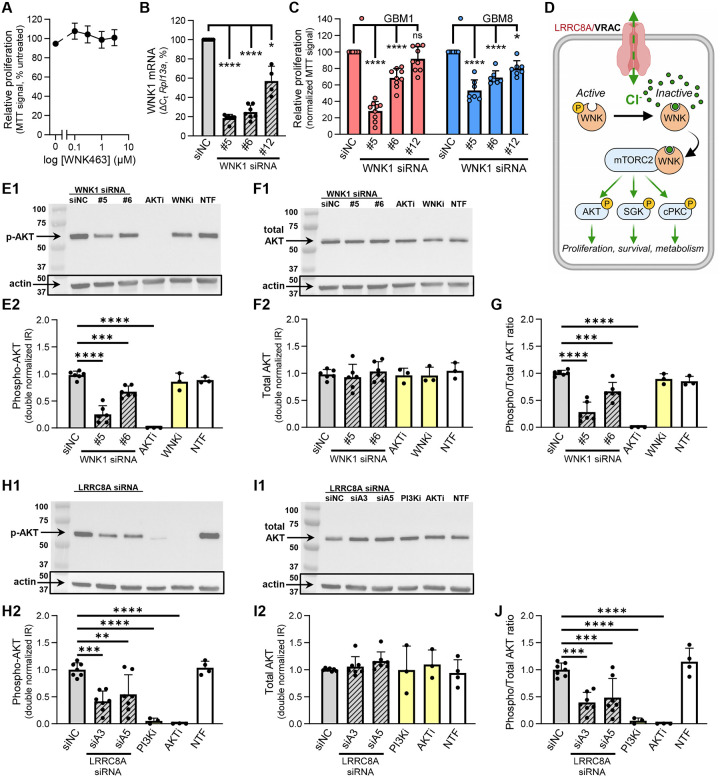
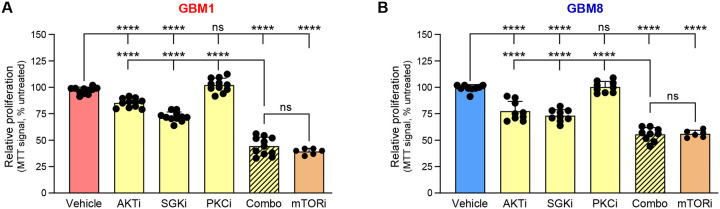
Leucine-rich repeat-containing protein 8A (LRRC8A) is the essential subunit of ubiquitous volume-regulated anion channels (VRACs). LRCC8A is overexpressed in several cancers and promotes negative survival outcomes via a poorly defined mechanism. Here, we explored the role of LRRC8A and VRACs in the progression of glioblastoma (GBM), the most common and deadly primary brain tumor. We found that, as compared to healthy controls, LRRC8A mRNA was strongly upregulated in surgical GBM specimens, patient-derived GBM cell lines, and GBM datasets from The Cancer Genome Atlas (TCGA). Our in-silico analysis indicated that patients belonging to the lowest LRRC8A expression quartile demonstrated a trend for extended life expectancy. In patient-derived GBM cultures, siRNA-driven LRRC8A knockdown reduced cell proliferation and additionally decreased intracellular chloride levels and inhibited activity of mTOR complex 2. The antiproliferative effect of LRRC8A downregulation was recapitulated with a pharmacological inhibitor of VRAC. Our ensuing biochemical and molecular biology analyses established that the LRRC8A-containing VRACs facilitate GBM proliferation via a new mechanism involving non-enzymatic actions of the chloride-sensitive protein kinase WNK1. Accordingly, the chloride-bound WNK1 stimulates mTORC2 and the mTORC2-dependent protein kinases AKT and SGK, which promote proliferation. These findings establish the new mTORC2-centric axis for VRAC dependent regulation of cellular functions and uncover potential targets for GBM intervention.

Keywords: Cancer; Cell biology; Molecular biology.


Conflict of interest statement

DECLARATION OF INTERESTS The authors report no competing interests.

Figures

Figure 1.
Figure 1.. LRRC8A is upregulated in human GBM specimens and patient-derived GBM cultures and promotes cell proliferation
(A1) Lrrc8 mRNA expression levels in surgically resected GBM tumor specimens (n=22) and healthy brain tissue (3 RNA medleys from 8 brains) measured using qRT-PCR and normalized to the housekeeping gene Rpl13a. ***p<0.001, GBM vs. normal brain. (A2) Comparison of Lrrc8 mRNA expression levels in patient derived GBM cell cultures (n=12) and primary human astrocytes (n=6). *p<0.05, **p<0.01, ***p<0.001, GBM vs. astrocytes. (A3) In-silico analysis of RNA-seq data for the expression of Lrrc8 isoforms in primary GBM (n=126) and healthy brain tissue (3 RNA medleys from 29 brains). GBM expression values were obtained from TCGA. Healthy brain tissue data were sourced from GEO repository, series GSE196695. ****p<0.0001, GBM vs. normal brain. In A1–A3, data are presented as boxplots with individual values and compared with an unpaired t-test with Welch correction and Holm-Šídák adjustment. (B) Representative images of the patient-derived GBM1 (LEFT) and GBM8 (RIGHT) cells. Images were acquired using Hoffman optics at identical 160× magnification. (C) VRAC activity in GBM1, GBM8, and primary human astrocytes measured as swelling activated release of preloaded D-[3H]aspartate. Cell swelling was induced by 30% reduction in medium osmolarity (HYPO). Mean values ±SEM from 4–6 independent experiments/cell line. (D1) Representative western blot image probing downregulation of LRRC8A in GBM1 and GBM8 cells treated with the LRRC8A-specific siRNAs, siA3 and siA5, and compared to the negative control siRNA (siNC). Lower inset shows the same membrane re-probed for β-actin immunoreactivity. (D2) Quantification of LRR8A expression in siRNA-treated GBM cultures. Mean values ±SD from 5 independent transfections/cell line. One-sample t-test with Bonferroni’s correction. ****p<0.0001 vs siNC. (E) Functional downregulation of VRAC activity in GBM1 cells treated with LRRC8A siRNA (siA5) and compared to siNC. Mean values ±SEM (n=5/condition). ***p<0.001 vs. siNC, t-test comparing integral D-[3H]aspartate release values during hypotonic exposure. (F) Effect of LRRC8A knockdown with the LRRC8A-specific siRNAs siA3 and siA5 on relative proliferation in GBM1 and GBM8 measured using the MTT assay. Mean values ±SD from 8–10 independent transfections. One-sample t-test with Bonferroni’s correction, ****p<0.0001 vs. siNC.
Figure 2.
Figure 2.. In-silico analysis of the relationship between Lrrc8a mRNA expression and life expectancy in GBM patients
(A) In-silico analysis of RNA-seq expression for Lrrc8a in primary GBM tissues (n=126) separated into quartiles. Data were sourced from TCGA and normalized using the DEseq2 variance-stabilizing transformation. Expression values presented as boxplots with individual values. (B) Kaplan-Meier plot of survival rates for GBM patients grouped by tumor Lrrc8a expression quartile. Median survival was compared between the lowest (Q1; n=27) and highest (Q4; n=27) Lrrc8a expressers using the Gehan-Breslow-Wilcoxon test. p=0.078.
Figure 3.
Figure 3.. Analysis of functional interactions between LRRC8A and GRB2-dependent growth factor signaling pathways in GBM
(A) Diagram depicting receptor tyrosine kinase (RTK)-ERK1/2 signaling pathway and its putative interactions with LRRC8A. For abbreviations and further information see text. (B,C,E) Western blot analysis of the effect of LRRC8A downregulation on ERK1/2 signaling in GBM1 cells. Representative images and quantification of phospho-ERK1/2 (B1–B2), total ERK1/2 (C1–C2), and phospho/total ERK1/2 immunoreactivity ratio (E). GBM1 cells were treated with the LRRC8A-specific siRNAs, siA3 and siA5, and compared to the negative control siNC (n=9). GBM1 cells treated with the ERK1/2 inhibitor Trametinib (Tram; 0.3 μM, 6-hr) and non-transfected cells (NTF) were included as additional controls (n=6–8). Data are the mean values ± SD. One-way ANOVA with Dunnett’s correction, ****p<0.0001, trametinib vs siNC. (D) Effect of the ERK1/2 signaling inhibitor U-0126 (ERKi; 10μM) on GBM1 and GBM8 proliferation as compared to vehicle control (Veh; 0.1% DMSO). Cell proliferation values were measured using the MTT assay and normalized to within-plate untreated cells (n=6/cell line). Data are the mean values ± SD. ns, not significant, unpaired t-test. (F) Diagram depicting RTK-JNK signaling pathway and its putative interactions with LRRC8A. For abbreviations and further information see text. (G,H,J) Western blot analysis of the effect of LRRC8A downregulation on JNK signaling in GBM1 cells using cJun phosphorylation as a readout. Representative images and quantification of phospho-cJun (G1–G2), total cJun (H1–H2), and phospho/total cJun immunoreactivity ratio (J) in GBM1 cells treated with the LRRC8A-specific siA3 and siA5 as compared to siNC. As controls, GBM1 were treated with the JNK inhibitor SP600125 (SP, 20 μM, 24-hr), the MKK4/7 inhibitor BSJ-04–122 (BSJ, 5μM, 24-hr), or the JNK activator anisomycin (Aniso; 10μM, 2-hr). Data are the mean values ± SD from 6 siRNA experiments and 3–4 pharmacological controls. One-way ANOVA with Dunnett’s correction, *p<0.05, **p<0.01, ***p<0.001, ****p<0.0001 vs. siNC. (I) Effect of the JNK signaling inhibitor SP600125 (JNKi, 20μM) on GBM1 and GBM8 proliferation. The MTT assay values were normalized to within-plate untreated cells and compared to the vehicle control (Veh; 0.1% DMSO). Data are the mean values ± SD (n=6–8/cell line). Unpaired t-test, ****p<0.0001 vs. Veh.
Figure 4.
Figure 4.. Analysis of functional interactions between LRRC8A and the GRB2-dependent PI3K/AKT/mTORC1 signaling axis in GBM
(A) Diagram depicting RTK-PI3K/AKT/mTORC1 signaling axis and its putative interactions with LRRC8A. For abbreviations and further information see text. (B,C,E) Western blot analysis of the effect of LRRC8A downregulation on mTORC1 signaling in GBM, measuring S6 phosphorylation as a readout. Representative images and quantification of phospho-S6 (B1–B2), total S6 (C1–C2), and phospho/total S6 immunoreactivity ratio (E). GBM1 cells were treated with the LRRC8A-specific siRNAs, siA3 and siA5, or the negative control siNC. As controls, cells were treated with the mTORC1 inhibitor Rapamycin (Rap, 10nM, 48-hr), or the mTORC1/2 blocker KU-0063794 (KU, 2.5 μM, 48-hr). NTF, non-transfected cells. Data are the mean values ± SD from 6 siRNA transfections or 2–3 pharmacological controls. One-way ANOVA with Dunnett’s correction, **p<0.01, ***p<0.001 vs. siNC. (E) Effect of the PI3K signaling inhibitor PI 828 (PI3Ki, 2.5μM) on GBM1 and GBM8 proliferation. The MTT assay values were normalized to within-plate untreated cells and compared to the vehicle control (Veh; 0.1% DMSO). Data are the mean values ± SD (n=6–7/cell line). Unpaired t-test, **p<0.01, ****p<0.0001 vs. Veh.
Figure 5.
Figure 5.. Effect of LRRC8A knockdown on [Cl]i and the Cl-sensitive WNK signaling axis
(A) Kinetics of 36Cl accumulation in GBM1 cells measured in a serum-containing cell culture medium. Data are the mean values ± SD of 4 independent assays. (B) Effect of LRRC8A knockdown on a steady state 36Cl accumulation in GBM1 cells. Cells were transfected with the LRRC8A-specific siRNAs, siA3 and siA5, or the negative control siNC. 96-h later, intracellular Cl levels were measured as steady state 36Cl uptake. Data are the mean values ± SD from 8 independent transfections. One-way ANOVA with Dunnett’s correction. **p<0.01, ****p<0.0001 vs. siNC. (C) Effect of the putative VRAC blocker DIDS (500 μM) on GBM1 and GBM8 cell proliferation as compared to untreated cells (WT). Proliferation was quantified using an MTT assay and normalized to untreated cells on the same plate. Data are the mean ±SD. n=4–10/cell line. One-sample t-test. *p<0.05, ****p<0.0001 vs WT. (D,E,G) Western blot analysis of the effect of LRRC8A downregulation on WNK signaling in GBM1, measured using SPAK phosphorylation as a readout. Representative images and quantification of phospho-SPAK (D1–D2), total SPAK (E1–E2), and phospho/total SPAK immunoreactivity ratio (G). GBM1 were treated with the LRRC8A-specific siA3 and siA5 or the negative control siNC (n=9). As controls, cells were treated with the WNK inhibitor WNK463 (‘WNKi’, 1μM, 24-hr) or hyperosmotic medium supplemented with 300 mM mannitol (‘Mann’, 1-hr treatment). NTF, non-transfected cells. n=4–6 for pharmacological controls. Data are the mean ±SD. One-way ANOVA with Dunnett’s correction, *p<0.05, **p<0.01, ***p<0.001, **** p<0.0001 vs. siNC. (F) Hypothetical diagram linking VRAC activity to the activity of the Cl sensitive WNK kinases and intracellular Cl homeostasis. The downstream protein kinases SPAK and OSR1 regulate activity of cation-chloride cotransporters NKCC1 and KCC1–4, which contribute to [Cl]i control.
Figure 6.
Figure 6.. LRRC8A knockdowns regulates mTORC2 signaling through WNK1-dependent mechanism
(A) Effect of WNK signaling inhibitor (WNK463, 0.1–3μM) on GBM1 proliferation. Proliferation rates were measured using the MTT assay and compared to vehicle control (0.1% DMSO). Data are the normalized mean values ± SD from 3 independent treatments. (B) Effect of WNK1 knockdown on Wnk1 mRNA levels. GBM1 cells were transfected with WNK1-specific siRNAs #5, #6, and #12 or the negative control siNC. Expression values were measured using qRT-PCR and normalized to Rpl13a. Data are the mean values ± SD. n=7 independent transfections. One-sample t-test with Bonferroni correction, *p<0.05, ****p<0.0001, vs. siNC. (C) Effect of WNK1 knockdown on proliferation in GBM1 and GBM8. Cells were treated with WNK1-specific siRNAs (#5, #6, and #12) or the negative control siNC. Proliferation was measured using an MTT assay. Data are the normalized mean values ±SD from 7–9 independent transfections/cell line. One-sample t-test with Bonferroni correction, ****p<0.0001 vs. siNC. (D) Diagram depicting hypothetical interaction between LRRC8A/VRAC, the Cl-dependent WNK1, and mTORC2 signaling in GBM. VRAC promotes higher [Cl]i and formation of the signaling complex between the Cl-bound WNK1 and mTORC2. mTORC2 activation promotes GBM proliferation via the downstream protein kinases AKT, SGK, and/or PKC. (E-G) Western blot analysis of the effect of WNK1 downregulation on mTORC2 signaling in GBM1 cells, measured using AKT phosphorylation as a readout. Representative images and quantification of phospho-AKT (E1–E2), total AKT (F1–F2), and phospho/total AKT immunoreactivity ratio (G). GBM1 cells were transfected with WNK1-specific siRNAs (#5, #6, and #12) or the negative control siNC (n=6). As additional controls (n=3), GBM1 were treated with the AKT inhibitor MK-2206 (AKTi, 2.5 μM, 24 h) and the WNK inhibitor WNK463 (WNKi, 1μM, 24 h). NTF, non-transfected cells. Data are the mean values ±SD. One-way ANOVA with Dunnett’s correction, ***p<0.001, **** p<0.0001 vs. siNC. (H-J) Western blot analysis of the effect of LRRC8A downregulation on mTORC2 signaling in GBM, using AKT phosphorylation as a readout. Representative images and quantification of phospho-AKT (H1–H2), total AKT (I1–I2), and phospho/total AKT immunoreactivity ratio (J). GBM1 were treated with siA3, siA5, or siNC (n=7). Non-transfected cells (NTF) and cells treated with the PI3K inhibitor PI 828 (PI3Ki, 2.5 μM, 24 h) or the AKT inhibitor MK-2206 (AKTi, 2.5 μM, 24 hr) were included as additional controls (n=3–4). Data are the mean values ± SD. One-way ANOVA with Dunnett’s correction, **p<0.01, ***p<0.001, ****p<0.0001 vs. siNC.
Figure 7.
Figure 7.. Effect of mTORC2-dependent signaling inhibition on GBM cell proliferation
(A) GBM1 cells were treated for 3 days with the inhibitors of AKT (AKTi; MK-2206, 2.5 μM), SGK (SGKi; GSK650394, 10 μM), PKC (PKCi; Gö6976, 3 μM), a combination of AKTi/SGKi/PKCi (Combo), or mTORC1/2 (mTORi; KU-0063794, 2.5 μM). The resulting effect on cell proliferation was measured using an MTT assay and compared to vehicle-treated cells (Veh; 0.167% DMSO). Data are the mean values ± SD from 6–9 independent treatments. One-way ANOVA with Bonferroni correction. ns, not significant, ****p<0.0001. (B) The same pharmacological treatments as shown in panel A were evaluated for their effects on proliferation of GBM8 cells (n=6–9). One-way ANOVA with Bonferroni correction. ns, not significant, ****p<0.0001.
Figure 8.
Figure 8.. LRRC8A-containing VRAC regulates GBM proliferation through a WNK1/mTORC2-dependent mechanism
Hypothetical model implicating the Cl-dependent WNK1/mTORC2 signaling as the mechanistic link between LRRC8A expression, VRAC activity, and GBM proliferation. VRAC activity is proposed to sustain high [Cl]i, promote formation of the complex between Cl-bound WNK1 and mTORC2. The subsequent increase in mTORC2 activity promotes GBM proliferation through activation of homologous AKT and SGK.

References

    1. Wen P.Y. and Kesari S. (2008). Malignant gliomas in adults. N. Engl. J. Med. 359, 492507. - PubMed
    1. Brennan C.W., Verhaak R.G., McKenna A., Campos B., Noushmehr H., Salama S.R., Zheng S., Chakravarty D., Sanborn J.Z., Berman S.H., Beroukhim R., Bernard B., Wu C.J., Genovese G., Shmulevich I., Barnholtz-Sloan J., Zou L., Vegesna R., Shukla S.A., Ciriello G., Yung W.K., Zhang W., Sougnez C., Mikkelsen T., Aldape K., Bigner D.D., van Meir E.G., Prados M., Sloan A., Black K.L., Eschbacher J., Finocchiaro G., Friedman W., Andrews D.W., Guha A., Iacocca M., O’Neill B.P., Foltz G., Myers J., Weisenberger D.J., Penny R., Kucherlapati R., Perou C.M., Hayes D.N., Gibbs R., Marra M., Mills G.B., Lander E., Spellman P., Wilson R., Sander C., Weinstein J., Meyerson M., Gabriel S., Laird P.W., Haussler D., Getz G., and Chin L. (2013). The somatic genomic landscape of glioblastoma. Cell 155, 462477. - PMC - PubMed
    1. Cloughesy T.F., Cavenee W.K., and Mischel P.S. (2014). Glioblastoma: from molecular pathology to targeted treatment. Annu. Rev. Pathol. 9, 1–25. - PubMed
    1. Ostrom Q.T., Price M., Neff C., Cioffi G., Waite K.A., Kruchko C., and Barnholtz-Sloan J.S. (2023). CBTRUS Statistical Report: Primary Brain and Other Central Nervous System Tumors Diagnosed in the United States in 2016–2020. Neuro. Oncol. 25, iv1–iv99. - PMC - PubMed
    1. Tan A.C., Ashley D.M., Lopez G.Y., Malinzak M., Friedman H.S., and Khasraw M. (2020). Management of glioblastoma: State of the art and future directions. CA Cancer J. Clin. 70, 299–312. - PubMed

Publication types

LinkOut - more resources