[Preprint]. 2025 Feb 8:2025.02.07.637096.
doi: 10.1101/2025.02.07.637096.

Benchmarking, detection, and genotyping of structural variants in a population of whole-genome assemblies using the SVGAP pipeline

Affiliations

Benchmarking, detection, and genotyping of structural variants in a population of whole-genome assemblies using the SVGAP pipeline

Ming Hu et al. bioRxiv. .

Abstract

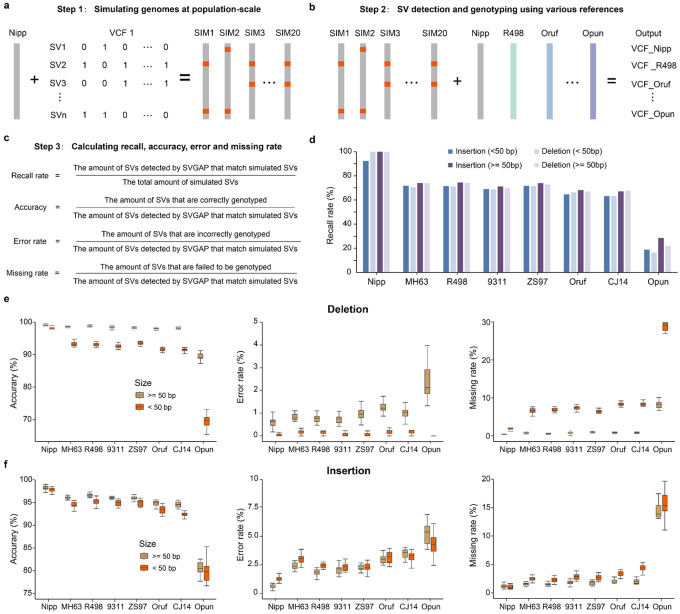
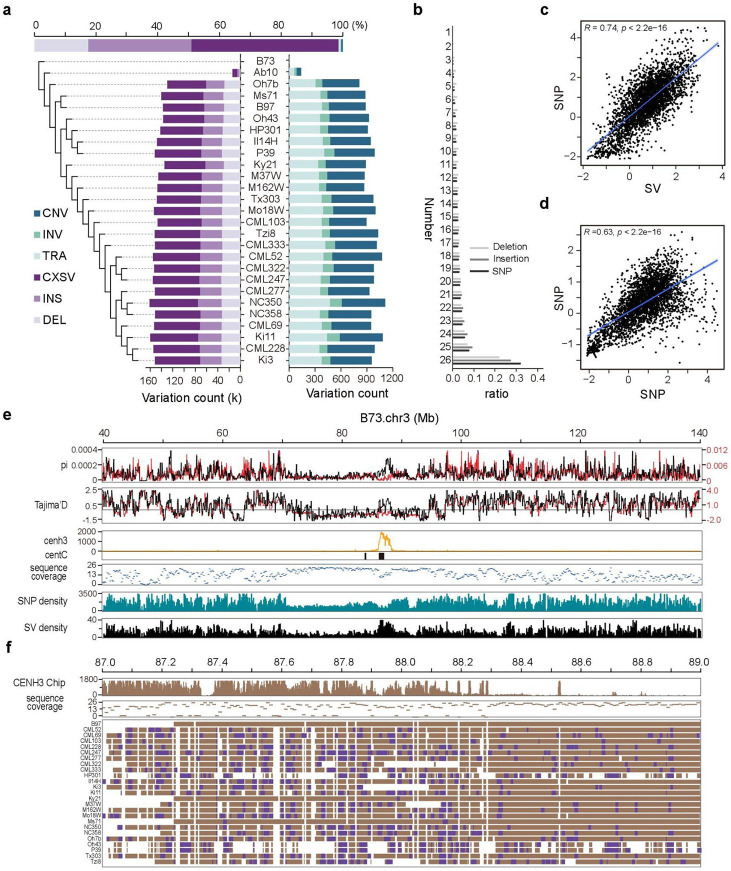
Comparisons of complete genome assemblies offer a direct procedure for characterizing all genetic differences among them. However, existing tools are often limited to specific aligners or optimized for specific organisms, narrowing their applicability, particularly for large and repetitive plant genomes. Here, we introduce SVGAP, a pipeline for structural variant (SV) discovery, genotyping, and annotation from high-quality genome assemblies at the population level. Through extensive benchmarks using simulated SV datasets at individual, population, and phylogenetic contexts, we demonstrate that SVGAP performs favorably relative to existing tools in SV discovery. Additionally, SVGAP is one of the few tools to address the challenge of genotyping SVs within large assembled genome samples, and it generates fully genotyped VCF files. Applying SVGAP to 26 maize genomes revealed hidden genomic diversity in centromeres, driven by abundant insertions of centromere-specific LTR-retrotransposons. The output of SVGAP is well-suited for pan-genome construction and facilitates the interpretation of previously unexplored genomic regions.


Figures

Fig. 1:
Fig. 1:. Overview of the SVGAP pipeline.
a, The six main steps in the SVGAP pipeline: (1) converting WGA results from external alignment tools into the desired AXT format files; (2) employing Kent’s utilities to construct syntenic alignments at chromosome-scale level; (3) identifying SVs between each sample and the reference; (4) merging SVs across samples to generate a unique SV call set. (5) Re-genotyping SVs and producing the fully genotyped VCF files; and (6) annotating SVs for understanding mechanisms underlying their formation. b, The flowchart and Perl scripts implemented in each step of the SVGAP pipeline.
Fig. 2:
Fig. 2:. The performance of six widely used WGA tools on genomes of Drosophila, rice, tomato, maize, pepper, and human, representing varying levels of complexity.
Metrics assessed include a. runtime, b. peak memory consumption, c. volume of raw alignments generated, and d. percent coverage of the reference. Each aligner's performance was measured by aligning two representative genomes within each species as shown in Supplementary Table 3. Black triangles mark instances of failed alignment.
Fig3:
Fig3:. Performance of SVGAP for SV detection across different aligners.
a, Analysis of shared SV calls—including deletions and insertions—among various aligners applied to two rice reference genomes. b, Comparative assessment of SVGAP performance in detecting SVs between a rice reference genome and its simulated counterpart, which includes introduced SVs. c, Phylogenetic relationships and estimated divergence times of selected rice (Oryza) genome assemblies, along with their approximate percentage of sequence alignment to the reference genome (MH63). d, Strategies for evaluating SVGAP performance across different aligners at varying levels of sequence divergence, along with the formulas used to calculate recall, precision, and F1 score. e and f, Comparison of SVGAP performance across aligners in detecting SVs, with panel e representing deletions and panel f insertions, at different levels of sequence divergence within the Oryza system.
Fig. 4:
Fig. 4:. Performance comparison of SVGAP with other methods.
a, Number of SV calls reported by different methods across various length ranges when comparing the two rice genomes, MH63 and ZS97. b, Ratio of deletions to insertions reported by different methods, again based on the two rice genomes. c, Overlap of SVs in pairwise comparisons among different methods. d, Recall for the benchmark analysis of deletions when comparing MH63 with 8 other divergent genomes, including simulated SVs. e, Precision of deletion detection. f, F1 score for deletions. g, Recall for the analysis of insertions. h, Precision of insertion detection. i, F1 score for insertions.
Fig. 5:
Fig. 5:. Benchmark analysis of merging and genotyping functions in SVGAP.
a, Strategies for simulating population-scale genomes. b, SV discovery among population-scale genomes when using eight divergent genomes as the references. c, Formulas for computing recall rate, accuracy, error rate, and missing rate. d, Recall comparing the reference genome Nipponbare with eight other rice genomes across varying divergence scales, categorized by length. e, Accuracy, error rate, and missing rate for deletions. f, Accuracy, error rate, and missing rate for insertions across sequence divergence.
Fig. 6:
Fig. 6:. SV discovery in maize and hidden genomic diversity uncovered around its centromeric regions.
a. SVs detected in 26 diverse maize genomes using SVGAP; b. Genotyping frequency for different types of genetic variations including insertion, deletion, and SNV across the samples; c. The plot graphs Tajima’s D calculated based on SNP and SV which detected by SVGAP across non-overlapping 100-kb windows of the maize genome, with the line indicating the correlation, which is strongly positive (Pearson r = 0.74, P = 2.2e-16); d. The plot graphs Tajima’s D calculated based on SNP detected by SVGAP in 26 maize genomes and SNP from a prior study, which identified SNP from 1,515 accessions across non-overlapping 100-kb windows of the maize genome. The line here too indicates a strong positive correlation (Pearson r = 0.63, P = 2.2e-16); e. Features of genetic variations and their population properties around the centromeric regions of chromosome 3. Panels from up to down indicate: the SVs (black line) and SNVs (red line) average pairwise diversity (π) for non-overlapping 100-kb windows, the SVs (black line) and SNVs (red line) Tajima’s D for non-overlapping 100-kb windows, CenH3 ChiP-seq reads mapping; distribution of maize centromeric specific tandem repeat (CentC), sequence coverage for non-overlapping 10-kb windows across the 26 maize genomes, SNV density, and SV density. f. The increased genomic diversity around the cen3 detected by SVs is attributable to the amplification of centromeric-specific retrotransposons.

Similar articles

References

    1. Alkan C., Coe B.P. and Eichler E.E. (2011) Genome structural variation discovery and genotyping. Nat. Rev. Genet., 12, 363–376. - PMC - PubMed
    1. Mahmoud M., Gobet N., Cruz-Dávalos D.I., Mounier N., Dessimoz C. and Sedlazeck F.J. (2019) Structural variant calling: the long and the short of it. Genome Biol., 20, 246. - PMC - PubMed
    1. Gaut B.S., Seymour D.K., Liu Q. and Zhou Y. (2018) Demography and its effects on genomic variation in crop domestication. Nat Plants, 4, 512–520. - PubMed
    1. Escaramís G., Docampo E. and Rabionet R. (2015) A decade of structural variants: description, history and methods to detect structural variation. Brief. Funct. Genomics, 14, 305–314. - PubMed
    1. Li Y., Roberts N.D., Wala J.A., Shapira O., Schumacher S.E., Kumar K., Khurana E., Waszak S., Korbel J.O., Haber J.E., et al. (2020) Patterns of somatic structural variation in human cancer genomes. Nature, 578, 112–121. - PMC - PubMed

Publication types

LinkOut - more resources