[Preprint]. 2025 Feb 14:2025.02.09.637107.
doi: 10.1101/2025.02.09.637107.

Cholesterol-mediated Lysosomal Dysfunction in APOE4 Astrocytes Promotes α-Synuclein Pathology in Human Brain Tissue

Affiliations

Cholesterol-mediated Lysosomal Dysfunction in APOE4 Astrocytes Promotes α-Synuclein Pathology in Human Brain Tissue

Louise A Mesentier-Louro et al. bioRxiv. .

Abstract

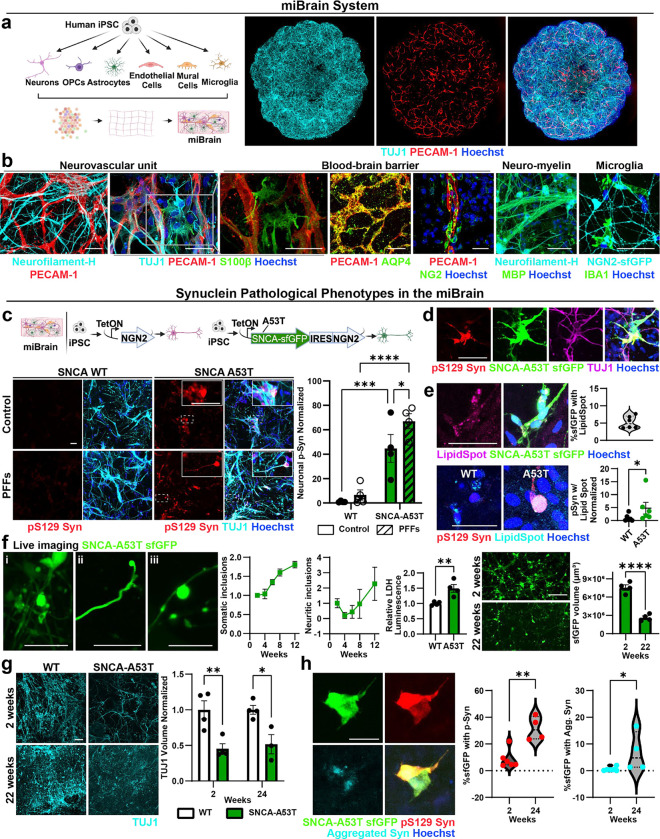
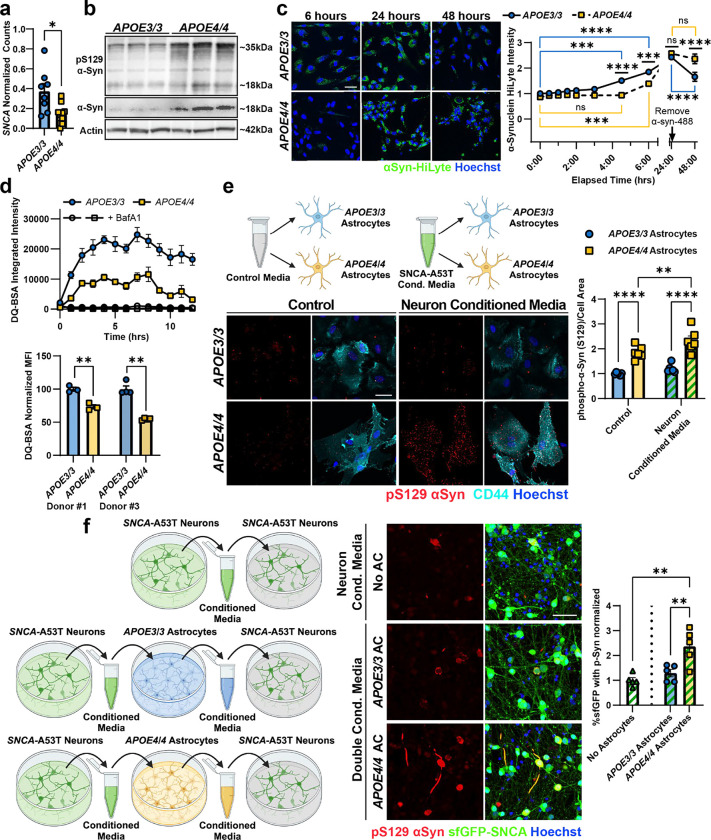
The pathological hallmark of neurodegenerative disease is the aberrant post-translational modification and aggregation of proteins leading to the formation of insoluble protein inclusions. Genetic factors like APOE4 are known to increase the prevalence and severity of tau, amyloid, and α-Synuclein inclusions. However, the human brain is largely inaccessible during this process, limiting our mechanistic understanding. Here, we developed an iPSC-based 3D model that integrates neurons, glia, myelin, and cerebrovascular cells into a functional human brain tissue (miBrain). Like the human brain, we found pathogenic phosphorylation and aggregation of α-Synuclein is increased in the APOE4 miBrain. Combinatorial experiments revealed that lipid-droplet formation in APOE4 astrocytes impairs the degradation of α-synuclein and leads to a pathogenic transformation that seeds neuronal inclusions of α-Synuclein. Collectively, this study establishes a robust model for investigating protein inclusions in human brain tissue and highlights the role of astrocytes and cholesterol in APOE4-mediated pathologies, opening therapeutic opportunities.

Keywords: APOE4; Alzheimer’s Disease; Astrocytes; Cholesterol metabolism; Lewy Body Dementia; Lysosomal dysfunction; Neurodegeneration; iPSC-derived brain model; miBrain; α-Synuclein.


Conflict of interest statement

Declaration of Interests V.K. is a cofounder of and senior advisor to DaCapo Brainscience and Yumanity Therapeutics, companies focused on CNS diseases. L.A.M.L, J.W.B., C.G., and R.B.R. are inventors on patent applications filed by Mount Sinai Innovation Partners on the methods described in this study. A.N. and V.K. are inventors on a patent application filed by Brigham and Women’s Hospital related to the induced inclusion iPSC models.

Figures

Extended Data Figure 1.
Extended Data Figure 1.. miBrain cryopreservation and development of α-synuclein intracellular inclusions.
a. Cartoon of the cryopreservation approach to preserve miBrains or smaller tissue units (miVasC: microvascular combo; BBB: blood-brain barrier; JAM: just add missing cell type). b. Top: cell viability upon thawing the cryopreserved tissue compared with fresh cells harvested and counted. Bars represent cell viability (%), and error bars represent standard deviation (n = 3 biological replicates). Bottom: quantification of the ratio between neurons and nuclei volume in 18 days-old thawed miBrain tissue from three different batches. Bars represent ratio between TUJ1 and Hoechst volumes, and error bars represent standard error (n = 3 batches with 4 to 8 biological replicates each). Representative images of two-week-old, thawed tissue stained with markers of neurons (cyan; neurofilament), astrocytes (green; S100b, GFAP), and endothelial cells (red; PECAM-1). Scale bars: 50 μm. c. Representative images of miBrains exposed to α-synuclein PFFs for 48h and stained at two weeks. Scale bars: 500 μm and 50 μm on lower and higher magnification, respectively. The levels of α-Syn phosphorylated at Serine 129 (pS129, red) were significantly increased in miBrains exposed to PFFs. Bars represent the intensity of pS129-Syn immunostaining normalized by nuclei and by control. Left graph shows the quantification of the experiment represented by the images. Error bars represent standard error (n = 4 biological replicates). P-values were calculated using an unpaired t-test. Right graph shows the quantification for the PFF treated group in three different experiments (n = 4 biological replicates each). Error bars represent standard error. Only experiments 1 and 2 had mean levels higher than control. Point dispersion in the bar graphs display high variability. d. Representative images of pS129 α-Syn in neurons generated from SNCA-A53T iPSCs, wild type (WT) iPSCs, or SNCA-A53T iPSCs without the non-amyloid component (NAC) domain. SNCA-A53T neurons had increased pS129 only in the presence of PFFs. Bars represent neuron volume, and error bars represent standard error (n = 4 biological replicates). P-values were calculated by 2-way ANOVA followed by a Tukey test. Scale bars: 50 μm. e. In A53T miBrains, the overlap between aggregated α-synuclein and Tom20 was significantly increased. Dot plot represents the median volume of aggregated α-Syn overlapping with Tom20 (n = 4 biological replicates). P-value was calculated using a Mann-Whitney test. Scale bar: 25 μm. *P < 0.05, **P < 0.01, ***P < 0.001, ****P < 0.0001.
Extended Data Figure 2.
Extended Data Figure 2.. Non-neuronal cells promote α-synuclein pathological phenotypes in APOE4 tissue.
a. Representative images of 2D APOE3/3 and APOE4/4 isogenic neuronal cultures overexpressing SNCA-A53T-sfGFP and exposed to PFFs for 2 weeks. Scale bar: 50 μm. pS129 was increased in both APOE3/3 and APOE4/4 SNCA-A53T neurons after exposure to PFFs when compared to WT controls. Bars represent mean volume of phosphorylated α-Syn per β-III tubulin volume and normalized to control APOE3/3 neurons; error bars represent standard error (n = 4 biological replicates). b. Cartoon depicting the experimental paradigm for generating isogenic APOE3/3 and APOE4/4 cells for miBrains. c. Cells were harvested on the day of miBrain assembly, and a subset of the cells was plated in monocultures and fixed after 24h. Representative images of APOE3/3 and APOE4/4 iPSC-derived cells stained for specific markers (green) of each cell type. Nuclei: blue. Scale bar: 20 μm. Bars represent mean values of the area immunoreactive for each cell marker normalized by nuclei and error bars represent standard error (n = 3 biological replicates). P-values were calculated using unpaired t-test. d. APOE4/4 miBrains had significantly higher levels of phosphorylated α-Syn outside the sfGFP volume compared with APOE3/3. Bars represent mean values of percent of sfGFP volume outside the sfGFP volume, normalized by APOE3/3. Error bars represent standard error (n = 8 biological replicates). P-values were calculated using unpaired t-test. e. Representative images of APOE3/3 and APOE4/4 miBrains with WT or SNCA-A53T-sfGFP neurons. WT miBrains were generated with isogenic APOE3/3 or APOE4/4 cells. A53T miBrains were generated with A53T neurons that were differentiated from an iPSC line from an APOE3/3 donor with familial Parkinson’s disease. All other cells were isogenic between each other except for the APOE locus. Scale bar: 50 μm. The presence of the SNCA-A53T neurons significantly increased the levels of pS129-Syn, but this effect was exacerbated when the non-neuronal cells harbored APOE4/4. Bars represent mean volume immunoreactive for phosphorylated α-Syn per nuclei volume and normalized to APOE3/3 miBrains with WT neurons. Error bars represent standard error (n = 4 biological replicates). P- values were calculated using 2-way ANOVA followed by a Fisher’s LSD test. f. Representative images of APOE3/3 and APOE4/4 miBrains with isogenic microglia and SNCA-A53T-sfGFP neurons. Scale bar: 50 μm. The presence of microglia in either APOE3/3 or APOE4/4 tissue did not significantly change the levels of pS129-Syn. Bars represent mean values of percent of sfGFP volume immunoreactive for phosphorylated α-Syn, and error bars represent standard error (n = 6 biological replicates per combination). P-values were calculated using 2-way ANOVA followed by a Fisher’s LSD test. *P < 0.05, **P < 0.01, ***P < 0.001, ****P < 0.0001.
Extended Data Figure 3.
Extended Data Figure 3.. Characterization of lysosomal function and α-Synuclein uptake and accumulation in astrocytes.
a. RNAseq analysis of isogenic, iPSC derived astrocytes for SNCA expression. Bars represent mean normalized counts and error bars represent standard error (n = 3 replicates). P-value was calculated by unpaired t-test. b. Western blots of APOE3/3 and APOE4/4 astrocytes for total α-Syn protein and phosphorylated α-Syn protein. Total and phosphorylated αSyn is increased in APOE4/4 astrocytes. The expected band size of α-Syn monomers is approximately 18kDa. β-Actin was used as a loading control. (n = 3 replicates). c. Representative images of astrocytes with α-Syn-HiLyte (green) after 24 hours of uptake and 24 hours of degradation after treatment with BafilomycinA1 and MG-132. αSyn degradation is only affected by lysosomal disruption in BafilomycinA1. Bars represent the mean α-Syn-HiLyte intensity per nuclei area, normalized to control astrocytes. Error bars represent standard error (n = 5 replicates). P-values were calculated by one-way ANOVA followed by Tukey test. d. Representative images of LAMP1 immunostaining (magenta) in two different isogenic iPSC lines. APOE4/4 astrocytes have significantly less LAMP1+ lysosomes. Bars represent mean intensity per nuclei area normalized to APOE3/3. Error bars represent standard error (n = 4 replicates). P-values were calculated using unpaired t-tests. e. LysoSensor mean fluorescence intensity after 1 minute incubation measured by flow cytometry in DAPI negative cells in three different isogenic iPSC lines. APOE4/4 astrocytes have significantly reduced LysoSensor signal compared to APOE3/3 astrocytes. Bars represent mean values normalized to APOE3/3 and error bars represent standard error (n = 3 replicates). P-values were calculated using unpaired t-tests. f. Top: Schematic of the experimental paradigm generating astrocyte conditioned media from APOE3/3 and APOE4/4 astrocytes. Bottom: Representative images of SNCA-A53T neurons treated with conditioned media from naïve APOE3/3 or APOE4/4 astrocytes, or with fresh neuron media. There was no differential effect between conditions. Bars represent mean pS129 volume normalized by sfGFP volume. Error bars represent standard error (n = 6 replicates). P-values were calculated using 1-way ANOVA followed by a Tukey test. g. Dot blots of SNCA-A53T conditioned media or double conditioned media from SNCA-A53T neurons and isogenic APOE3/3 or APOE4/4 astrocytes for total αSyn, phosphorylated αSyn, and aggregated αSyn. All dots were on one blot; the image was cropped to fit for the figure. Bars represent mean intensity and error bars represent standard error (n = 4 replicates). P-values were calculated by unpaired, t-tests. All scale bars = 50 μm. *P < 0.05, **P < 0.01, ***P < 0.001, ****P < 0.0001.
Extended Data Figure 4.
Extended Data Figure 4.. MβCD treatment in APOE4/4 astrocytes improves lysosomal uptake of α-Synuclein.
a. Volcano plot of APOE4/4 vs. APOE3/3 astrocytes showing DEGs (p val adj < 0.5, abs(logFC > 0.5). Top 10 Gene Ontology (GO) upregulated (red) and downregulated (blue) pathways ranked by adjusted p-value. Genes highlighted in the volcano plot correspond to GO terms related to lipid metabolism, including “fatty acid oxidation”, “cellular response to fatty acid”, “regulation of lipid storage”, “monocarboxylic acid transport”, “fatty acid transport”, “cholesterol transfer activity”, and “cholesterol metabolic process”. b. Left: DQ-BSA Red integrated intensity in astrocytes with 2HβCD or MβCD treatment, measured over 24 hours on an Incucyte (Sartorius) in a second isogenic donor line. Data points represent mean values and error bars represent standard error (n = 4 replicates). Right: Area under the curve calculation for DQ-BSA. Treatment of APOE4/4 astrocytes with MβCD improved lysosomal proteolytic activity in a second donor line. Bars represent mean value and error bars represent standard error (n = 4 replicates). P-values were calculated by 2-way ANOVA followed by a Tukey test. c. Representative images of LysoTracker in astrocytes treated with cyclodextrins in a second isogenic donor line. Treatment with cyclodextrins increased endolysosomal area. Bars represent LysoTracker mean intensity (magenta) normalized by Hoechst area (blue). Error bars represent standard error (n = 5–6 replicates) P-values were calculated by 2-way ANOVA followed by a Sidak test. d. Representative images of astrocytes treated with cyclodextrins after a 24h incubation with fluorescently labeled α-Syn in a second isogenic donor line. Cyclodextrin treated astrocytes have increased α-Syn uptake compared to untreated APOE4/4 astrocytes. Bars represent α-Syn mean intensity (green) normalized by Hoechst area (blue). Error bars represent standard error (n = 6 replicates) P-values were calculated by 2-way ANOVA followed by a Tukey test. e. Representative images of fluorescently labeled α-Syn co-localized with endolysosomes in astrocytes treated with cyclodextrins. Cyclodextrin treated astrocytes had increased co-localization between α-Syn and lysosomes compared to untreated APOE4/4, indicative of improved α-Syn uptake. Bars represent mean Mander’s coefficient M2 (amount of a-Syn signal in overlapping LysoTracker). Error bars represent standard error (n = 8 replicates). P-values were calculated by 2-way ANOVA followed by a Fisher’s LSD test. All scale bars = 50 μm. *P < 0.05, **P < 0.01, ***P < 0.001, ****P < 0.0001.
Figure 1.
Figure 1.. Induction of α-Syn intracellular inclusions in a multi-cellular integrated Brain (miBrain) tissue.
a. Cartoon and representative images of our multicellular integrated human brain (miBrain) tissue generated from human iPSCs differentiated into six brain cell types, including neurons, glia, and vascular cells. Four-week-old miBrains showing neurons (TUJ1, cyan) and vascular networks (PECAM-1, red). Scale bar: 500 μm. Nuclei: blue. b. miBrains stained for specific markers of neurons (cyan; Neurofilament-H, TUJ1, NGN2-sfGFP), astrocytes (green; S100b, AQP4), endothelial cells (red; PECAM-1), mural cells (green; NG2), myelin (green; MBP), and microglia (green; IBA1). Scale bar: 50 μm, nuclei: blue. c. miBrains containing neurons generated through direct iPSC reprograming via NGN2 expression, with or without the overexpression of SNCA-A53T. The tissue was cultured for a total of 18 days, with or without α-synuclein PFFs added on day 4. Immunofluorescence for neuronal marker TUJ1 and for α-Syn phosphorylated at Serine 129 (pS129) shows a robust expression of pS129-Syn in A53T neurons within the miBrains, but not in WT tissue. Scale bar: 50 μm, nuclei: blue. Neuronal pS129 expression was significantly increased in miBrains with A53T neurons. Exposure to PFFs exacerbated this effect. Bars represent means of pS129-Syn+ volume within TUJ1+ neurons normalized to control WT. Error bars represent standard error (n = 4 biological replicates). P-values were calculated using a 2-way ANOVA followed by a Fisher’s LSD test. d. SNCA-A53T was fused to small folding green fluorescent protein (sfGFP). pS129-Syn+ inclusions co-localize with sfGFP expression in TUJ1+ cells. Scale bar: 50 μm, nuclei: blue. e. Representative images depicting the co-localization of SNCA-A53T-sfGFP (green) and neutral lipid marker Lipid Spot (magenta) in A53T miBrains, or p-Syn (red) and Lipid Spot (cyan) in wild type and A53T miBrains cultured for two weeks. Arrowhead points to a lipid droplet within a p-Syn+ inclusion. The violin plot shows the percentage of sfGFP-SNCA volume occupied by the overlapping signal of Lipid Spot. The sfGFP-SNCA volume overlapped at 5.2 % ± 0.7 with lipid droplet marker Lipid Spot (mean ± standard error, n = 6 biological replicates). Dot plots represent the median overlapping volume between p-Syn and Lipid Spot normalized by nuclei (n = 5–6 biological replicates). P-values were calculated by Mann-Whitney test. Scale bar: 50 μm. f. Live imaging of SNCA-A53T-sfGFP in cell bodies (i), neurites (ii), and varicose-like inclusions (iii). Scale bars: 25 μm (i, ii) and 15 μm (iii). Line graphs show the number of somatic and neuritic inclusions normalized by the sfGFP volume over time (n = 4 biological replicates). Compared to WT, miBrains with A53T neurons had a significant increase in the levels of lactate dehydrogenase (LDH) in the media, indicating cell death. Bars represent mean LDH luminescence normalized to WT control, and error bars represent standard error (n = 4 biological replicates). P-values were calculated using an unpaired t-test. Representative images of live tracking of SNCA-A53T-sfGFP imaging and quantification at 2 and 22 weeks after miBrain assembly revealed a reduction in sfGFP area between 2 and 22 weeks (p < 0.0001). Bars represent mean sfGFP volume. Error bars represent standard error (n = 4 biological replicates). Scale bar: 100 μm. g. Representative images of miBrains with A53T or WT neurons. The volume occupied by neurons (cyan; TUJ1) was significantly reduced in miBrains with A53T neurons when compared with WT at 2 and 24 weeks. Bars represent TUJ1+ volume and error bars represent standard error (n = 3 biological replicates). P-values were calculated by 2-way ANOVA followed by a Tukey test. Scale bar: 50 μm. h. Representative images of A53T miBrains stained for pS129 α-synuclein (red) and aggregated α-synuclein (cyan) 24 weeks after assembly. Bars represent the percent volume of sfGFP-SNCA occupied by either pS129 α-Syn or aggregated α-synuclein staining. P-values were calculated by Mann-Whitney test. Scale bar: 25 μm. *P < 0.05, **P < 0.01, ***P < 0.001, ****P < 0.0001
Figure 2.
Figure 2.. APOE4 increases the phosphorylation and aggregation of α-Syn via astrocytes.
a. Using CRISPR-Cas9 on an APOE3/3 iPSC line, we generated isogenic iPSCs harboring APOE4/4 and differentiated them into neurons with SNCA-A53T overexpression. We generated miBrains with APOE3/3 or APOE4/4 isogenic cells. Representative images of phosphorylated α-Syn immunoreactivity in APOE3/3 and APOE4/4 isogenic miBrains. Higher magnification panel depicts co-localized immunoreactivity between pS129 (red), SNCA-A53T-sfGFP (green) and TUJ1 (magenta). Scale bars: 50 μm. APOE4/4 miBrains had significantly higher levels of pS129 (red) compared with APOE3/3. Bars represent mean values of percent of sfGFP volume immunoreactive for phosphorylated α-Syn, normalized by APOE3/3. Error bars represent standard error (n = 8 biological replicates). P-values were calculated using unpaired t-test. b. We generated miBrains with APOE3/3 or APOE4/4 isogenic cells, including miBrains with one cell type at a time harboring APOE4/4 (yellow boxes) and the remaining cells APOE3/3 (blue boxes). Representative images of phosphorylated α-Syn in a combinatorial screen of APOE3/3 and APOE4/4 isogenic cell types. APOE4/4 and APOE3/3 miBrains with APOE4/4 astrocytes had equivalent levels of pS129 α-Syn (red). These levels were significantly higher than in miBrains where all cells harbored APOE3/3 or where any cell type except astrocytes harbored APOE4/4. Bars represent mean values of percent of sfGFP volume immunoreactive for phosphorylated α-Syn, and error bars represent standard error (n = 8 biological replicates per combination). P-values were calculated using one-way ANOVA followed by a Dunnett’s Multiple Comparisons Test. Scale bar: 50 μm. c. Representative images of GFAP immunoreactivity in APOE3/3 and APOE4/4 miBrains. Scale bar: 50 μm. APOE4/4 miBrain astrocytes (GFAP+) had reduced overlap with sfGFP-SNCA, increased circularity and significantly higher levels of GFAP (magenta) compared with APOE3/3. Bars represent mean values of GFAP volume and circularity and error bars represent standard error (n = 4 biological replicates). P-values were calculated using unpaired t-test. *P < 0.05, **P < 0.01, ***P < 0.001, ****P < 0.0001
Figure 3.
Figure 3.. Impaired lysosomal function of APOE4/4 astrocytes seeds α-Syn phosphorylation in neurons.
a. Pseudobulk analysis of human astrocytes (Haney et al. 2024) for SNCA expression. Bars represent mean normalized psuedobulk gene count and error bars represent standard error (n = 8 APOE3/3 and n = 10 APOE4/4). P-value was calculated using unpaired t-test. b Western blots of APOE3/3 and APOE4/4 astrocytes for total α-Syn protein and phosphorylated α-Syn protein. Total and phosphorylated αSyn is increased in APOE4/4 astrocytes. The expected band size of α-Syn monomers is approximately 18kDa. β-Actin was used as a loading control. (n = 3 replicates). c. Representative images of uptake and degradation of exogenous, fluorescently labeled α-Syn (green). α-Syn was removed from the culture media after 24 hours. APOE3/3 astrocytes uptake and degrade αSyn more readily than APOE4/4 astrocytes. Data points represent mean values of α-Syn-HiLyte mean intensity normalized to nuclei area and APOE3/3 at the first time point. Error bars represent standard error (n = 4 replicates). P-values were calculated using 2-way ANOVA followed by a Tukey test. d. Left: DQ-BSA Red integrated intensity per cell confluency measured over 24 hours on an Incucyte (Sartorius). BafilomycinA1 at 100nM was used as a control for non-lysosomal proteolysis of DQ-BSA. Data points represent mean values and error bars represent standard error (n = 4 replicates). Right: DQ-BSA Green mean fluorescence intensity measured in DAPI negative cell population by flow cytometry after 24 hours in two different isogenic iPSC lines. Bars represent mean values normalized to APOE3/3 and error bars represent standard error (n = 3 replicates). P-values were calculated by unpaired t-tests. e. Representative images of pS129 α-Syn (red) in APOE3/3 and APOE4/4 astrocytes after exposure to fresh or conditioned neuron media. APOE4/4 astrocytes have more pS129 a-Syn, which is further increased upon incubation with neuronal media. Data points represent mean values of pS129 a-Syn normalized to cell area (CD44; cyan), and error bars represent standard error (n = 6 replicates). P-values were calculated using 2-way ANOVA followed by a Fisher’s LSD test. f. Left: schematic of the experimental paradigm generating “double conditioned media” from APOE/3 or APOE4/4 astrocytes previously exposed to neuronal media. Center, right: Representative images of SNCA-A53T neurons treated with neuron conditioned media or neuron and astrocyte conditioned media. Neurons treated with APOE4/4 double conditioned media showed significant increase in pS129 α-Syn compared to all other conditions. Bars represent mean pS129 volume normalized by sfGFP volume. Error bars represent standard error (n = 5 replicates). P-values were calculated using 1-way ANOVA followed by a Tukey test. All scale bars = 50 μm. *P < 0.05, **P < 0.01, ***P < 0.001, ****P < 0.0001.
Figure 4.
Figure 4.. Reducing cholesterol improves APOE4/4 astrocyte lysosomal and α-Syn homeostasis.
a. Representative images of live astrocytes with BODIPY-cholesterol in two isogenic lines. APOE4/4 astrocytes have significantly more BODIPY-cholesterol staining than APOE3/3 astrocytes. Bars represent BODIPY-cholesterol mean intensity (green) normalized by Hoechst area (blue). Error bars represent standard error (n = 3 replicates). P-values were calculated by unpaired t-tests. b. Representative images of BODIPY staining in astrocytes treated with 2HβCD or MβCD. APOE4/4 astrocytes have more BODIPY staining than APOE3/3 astrocytes, which is reduced after treatment. Bars represent BODIPY punctae (green) per cell number (Hoechst; blue). Error bars represent standard error (n = 6 replicates). P-values were calculated by 2-way ANOVA followed by a Tukey test. c. Top: DQ-BSA Red integrated intensity, in astrocytes with 2HβCD, MβCD, atorvastatin, efavirenz, LXR-623, or T0901317 treatment, measured over 24 hours on an Incucyte (Sartorius). Data points represent mean values and error bars represent standard error (n = 4 replicates). Bottom: area under the curve calculation for DQ-BSA. Treatment of APOE4/4 astrocytes with cyclodextrins, but not other drugs, improved lysosomal proteolytic activity. Bars represent mean value and error bars represent standard error (n = 4 replicates). P-values were calculated by 2-way ANOVA followed by a Tukey test. d. Representative images of LysoTracker in astrocytes treated with 2HβCD or MβCD. Treatment with cyclodextrins increased endolysosomal intensity. Bars represent LysoTracker mean intensity (magenta) normalized by Hoechst area (blue). Error bars represent standard error (n = 5–6 replicates) P-values were calculated by 2-way ANOVA followed by a Sidak test. e. Representative images of astrocytes treated with cyclodextrins after a 24h incubation with fluorescently labeled α-Syn, in two isogenic lines. Cyclodextrin treated astrocytes have increased α-Syn uptake compared to untreated APOE4/4 astrocytes. Bars represent a-Syn mean intensity (green) normalized by Hoechst area (blue). Error bars represent standard error (n = 6 replicates) P-values were calculated by 2-way ANOVA followed by a Tukey test. f. Representative images of phosphorylated α-Syn in isogenic APOE3/3 and APOE4/4 miBrains. APOE4/4 miBrains had significantly higher levels of pS129 (red) than APOE3/3. These levels were significantly reduced in APOE4/4 miBrains treated with MβCD. Bars represent mean values of percent of sfGFP volume immunoreactive for phosphorylated α-Syn and error bars represent standard error (n = 8 replicates). P-values were calculated using two-way ANOVA followed by a Tukey test. All scale bars = 50 μm. *P < 0.05, **P < 0.01, ***P < 0.001, ****P < 0.0001.

References

    1. Hardy JA, Higgins GA. Alzheimer’s disease: the amyloid cascade hypothesis. Science. Apr 10 1992;256(5054):184–5. doi:10.1126/science.1566067 - DOI - PubMed
    1. Kotzbauer PT, Trojanowsk JQ, Lee VM. Lewy body pathology in Alzheimer’s disease. J Mol Neurosci. Oct 2001;17(2):225–32. doi:10.1385/jmn:17:2:225 - DOI - PubMed
    1. Uchikado H, Lin WL, DeLucia MW, Dickson DW. Alzheimer disease with amygdala Lewy bodies: a distinct form of alpha-synucleinopathy. J Neuropathol Exp Neurol. Jul 2006;65(7):685–97. doi:10.1097/01.jnen.0000225908.90052.07 - DOI - PMC - PubMed
    1. Popescu A, Lippa CF, Lee VM, Trojanowski JQ. Lewy bodies in the amygdala: increase of alpha-synuclein aggregates in neurodegenerative diseases with tau-based inclusions. Arch Neurol. Dec 2004;61(12):1915–9. doi:10.1001/archneur.61.12.1915 - DOI - PubMed
    1. Lippa CF, Fujiwara H, Mann DM, et al. Lewy bodies contain altered alpha-synuclein in brains of many familial Alzheimer’s disease patients with mutations in presenilin and amyloid precursor protein genes. Am J Pathol. Nov 1998;153(5):1365–70. doi:10.1016/s0002-9440(10)65722-7 - DOI - PMC - PubMed

Publication types

LinkOut - more resources