

Interactions between NAD+ metabolism and immune cell infiltration in ulcerative colitis: subtype identification and development of novel diagnostic models
- PMID: 39975557
- PMCID: PMC11835821
- DOI: 10.3389/fimmu.2025.1479421
Interactions between NAD+ metabolism and immune cell infiltration in ulcerative colitis: subtype identification and development of novel diagnostic models
Abstract
Background: Ulcerative colitis (UC) is a chronic inflammatory disease of the colonic mucosa with increasing incidence worldwide. Growing evidence highlights the pivotal role of nicotinamide adenine dinucleotide (NAD+) metabolism in UC pathogenesis, prompting our investigation into the subtype-specific molecular underpinnings and diagnostic potential of NAD+ metabolism-related genes (NMRGs).
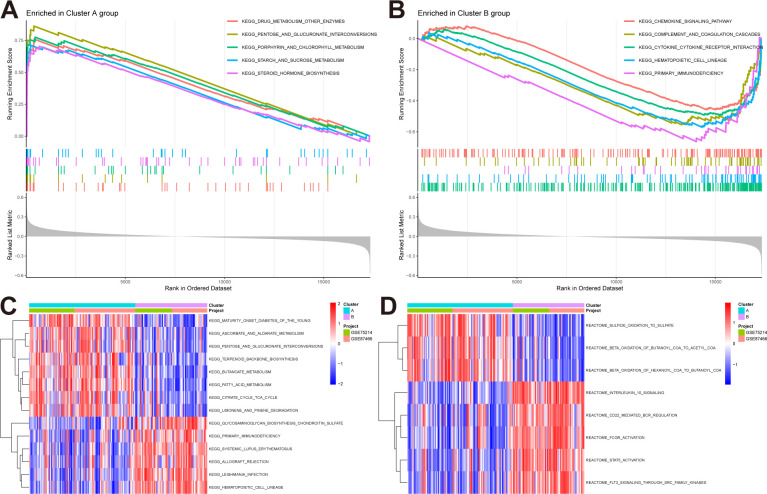
Methods: Transcriptome data from UC patients and healthy controls were downloaded from the GEO database, specifically GSE75214 and GSE87466. We performed unsupervised clustering based on differentially expressed NAD+ metabolism-related genes (DE-NMRGs) to classify UC cases into distinct subtypes. GSEA and GSVA identified potential biological pathways active within these subtypes, while the CIBERSORT algorithm assessed differential immune cell infiltration. Weighted gene co-expression network analysis (WGCNA) combined with differential gene expression analysis was used to pinpoint specific NMRGs in UC. Robust gene features for subtyping and diagnosis were selected using two machine learning algorithms. Nomograms were constructed and their effectiveness was evaluated using receiver operating characteristic (ROC) curves. Reverse transcription quantitative polymerase chain reaction (RT-qPCR) was conducted to verify gene expression in cell lines.
Results: In our study, UC patients were classified into two subtypes based on DE-NMRGs expression levels, with Cluster A exhibiting enhanced self-repair capabilities during inflammatory responses and Cluster B showing greater inflammation and tissue damage. Through comprehensive bioinformatics analyses, we identified four key biomarkers (AOX1, NAMPT, NNMT, PTGS2) for UC subtyping, and two (NNMT, PARP9) for its diagnosis. These biomarkers are closely linked to various immune cells within the UC microenvironment, particularly NAMPT and PTGS2, which were strongly associated with neutrophil infiltration. Nomograms developed for subtyping and diagnosis demonstrated high predictive accuracy, achieving area under curve (AUC) values up to 0.989 and 0.997 in the training set and up to 0.998 and 0.988 in validation sets. RT-qPCR validation showed a significant upregulation of NNMT and PARP9 in inflamed versus normal colonic epithelia, underscoring their diagnostic relevance.
Conclusion: Our study reveals two NAD+ subtypes in UC, identifying four biomarkers for subtyping and two for diagnosis. These findings could suggest potential therapeutic targets and contribute to advancing personalized treatment strategies for UC, potentially improving patient outcomes.
Keywords: NAD+ metabolism; bioinformatics; diagnosis; immune cell infiltration; machine learning; subtype; ulcerative colitis.
Copyright © 2025 Tian, Gao, Yao, Chen, Gao, Han, Zhu and Huang.
Conflict of interest statement
The authors declare that the research was conducted in the absence of any commercial or financial relationships that could be construed as a potential conflict of interest.
Figures


Similar articles
-
An Integrative analysis of single-cell RNA-seq, transcriptome and Mendelian randomization for the Identification and validation of NAD+ Metabolism-Related biomarkers in ulcerative colitis.Int Immunopharmacol. 2025 Jan 3;145:113765. doi: 10.1016/j.intimp.2024.113765. Epub 2024 Dec 7. Int Immunopharmacol. 2025. PMID: 39647286
-
Precision therapy for ulcerative colitis: insights from mitochondrial dysfunction interacting with the immune microenvironment.Front Immunol. 2024 Jul 4;15:1396221. doi: 10.3389/fimmu.2024.1396221. eCollection 2024. Front Immunol. 2024. PMID: 39026683 Free PMC article.
-
Age-related genes affecting the immune cell infiltration in ulcerative colitis revealed by weighted correlation network analysis and machine learning.Eur Rev Med Pharmacol Sci. 2023 Sep;27(18):8447-8462. doi: 10.26355/eurrev_202309_33768. Eur Rev Med Pharmacol Sci. 2023. PMID: 37782162
-
Unveiling the key genes, environmental toxins, and drug exposures in modulating the severity of ulcerative colitis: a comprehensive analysis.Front Immunol. 2023 Jul 19;14:1162458. doi: 10.3389/fimmu.2023.1162458. eCollection 2023. Front Immunol. 2023. PMID: 37539055 Free PMC article. Review.
-
Angel and devil: the protective immunity and pathogenic inflammation of tissue resident memory T cells in ulcerative colitis.Front Immunol. 2025 Mar 7;16:1518339. doi: 10.3389/fimmu.2025.1518339. eCollection 2025. Front Immunol. 2025. PMID: 40124381 Free PMC article. Review.
References
Publication types
MeSH terms
Substances
LinkOut - more resources
Full Text Sources
Medical
Research Materials
Miscellaneous