

How to measure consumer's inconsistency in sensory testing?
- PMID: 39975563
- PMCID: PMC11836509
- DOI: 10.1016/j.crfs.2025.100982
How to measure consumer's inconsistency in sensory testing?
Abstract
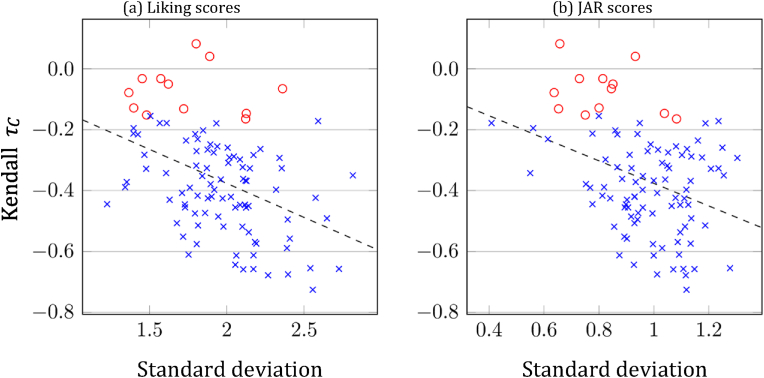
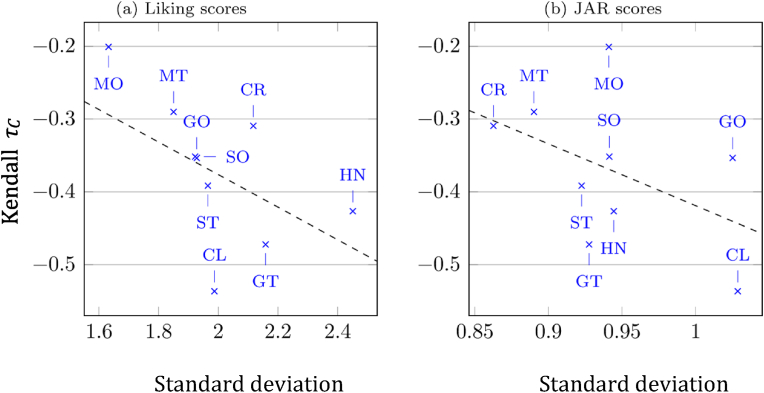
Consumer sensory testing is the basis for determining directions of product development in the food industry. However, while compliance assessment by trained and expert assessors is well developed, few information is available on testing consumer consistency. Therefore, we provide a statistical framework to rank assessors and attributes according to the level of inconsistency, as well as to identify inconsistent assessors, based on Kendall rank correlation coefficients. The detection of (in)consistency requires evaluations on two connected scales. The suggested approach is illustrated by data from sensory tests of biscuits enriched with three pollens at different levels. 100 consumers evaluated the samples on two different scales (nine category monotonic ascending hedonic response scale, five-category just about right (JAR) intensity scale). The 88 consistent assessors are found using a wider range of both the liking scale and JAR scale than the 12 inconsistent assessors whose evaluations do not have a significantly negative rank correlation. Future consumer tests are recommended to include multiple scales. The proposed framework aims to identify and even filter out the potentially biasing inconsistent evaluations. Questions on attributes leading to highly inconsistent responses should be reconsidered in future sensory tests on the same food product.
Keywords: Consistency; Consumer sensory testing; JAR scale; Liking score; Product development.
© 2025 The Authors. Published by Elsevier B.V.
Conflict of interest statement
The authors declare that they have no known competing financial interests or personal relationships that could have appeared to influence the work reported in this paper.
Figures


Similar articles
-
Discrimination of sensory attributes by trained assessors and consumers in semi-sweet hard dough biscuits and their drivers of liking and disliking.Food Res Int. 2019 Aug;122:599-609. doi: 10.1016/j.foodres.2019.01.031. Epub 2019 Jan 15. Food Res Int. 2019. PMID: 31229119
-
Identification of sensory properties driving consumers' liking of commercially available kale and arugula.J Sci Food Agric. 2022 Jan 15;102(1):198-205. doi: 10.1002/jsfa.11346. Epub 2021 Jun 10. J Sci Food Agric. 2022. PMID: 34061358
-
Biscuits Enriched with Monofloral Bee Pollens: Nutritional Properties, Techno-Functional Parameters, Sensory Profile, and Consumer Preference.Foods. 2022 Dec 21;12(1):18. doi: 10.3390/foods12010018. Foods. 2022. PMID: 36613234 Free PMC article.
-
Role of Sensory Evaluation in Consumer Acceptance of Plant-Based Meat Analogs and Meat Extenders: A Scoping Review.Foods. 2020 Sep 22;9(9):1334. doi: 10.3390/foods9091334. Foods. 2020. PMID: 32971743 Free PMC article.
-
A narrative review of the impact of digital immersive technology on affective and sensory responses during product testing in digital eating contexts.Food Res Int. 2021 Dec;150(Pt B):110804. doi: 10.1016/j.foodres.2021.110804. Epub 2021 Nov 9. Food Res Int. 2021. PMID: 34863496 Review.
Cited by
-
Trends and Directions of Preference Elicitation and Assessment in Food Science: Single-, Pair-, and Multi-Criteria Ranking Methods.Food Sci Nutr. 2025 Jul 31;13(8):e70684. doi: 10.1002/fsn3.70684. eCollection 2025 Aug. Food Sci Nutr. 2025. PMID: 40746653 Free PMC article. Review.
-
Development and Validation of a Consumer-Oriented Sensory Evaluation Scale for Pale Lager Beer.Foods. 2025 Aug 15;14(16):2834. doi: 10.3390/foods14162834. Foods. 2025. PMID: 40870746 Free PMC article.
References
-
- AACC . AACC; Washington, DC, USA: 1980. Approved Method 10-50D: Baking Quality of Cookie Flour.
-
- Ágoston K. Cs, Csató L. Inconsistency thresholds for incomplete pairwise comparison matrices. Omega. 2022;108
-
- Aguarón J., Moreno-Jiménez J.M. The geometric consistency index: approximated thresholds. Eur. J. Oper. Res. 2003;147(1):137–145.
-
- Aguirre V.M., Huerta-Pacheco N.S., Lopez M.T. CONS an R based graphical interface to perform Consonance Analysis. Food Qual. Prefer. 2017;62:183–189.
-
- Alam M., Alam M., Hakim M., Huq A.O., Moktadir S.G. Development of fiber enriched herbal biscuits: a preliminary study on sensory evaluation and chemical composition. Int. J. Food Sci. Nutr. 2014;3:246–250.
LinkOut - more resources
Full Text Sources
