[Preprint]. 2025 Jan 20:rs.3.rs-5671197.
doi: 10.21203/rs.3.rs-5671197/v1.

Structural basis of vilazodone dual binding mode to the serotonin transporter

Affiliations

Structural basis of vilazodone dual binding mode to the serotonin transporter

Iris E Kalenderoglou et al. Res Sq. .

Abstract

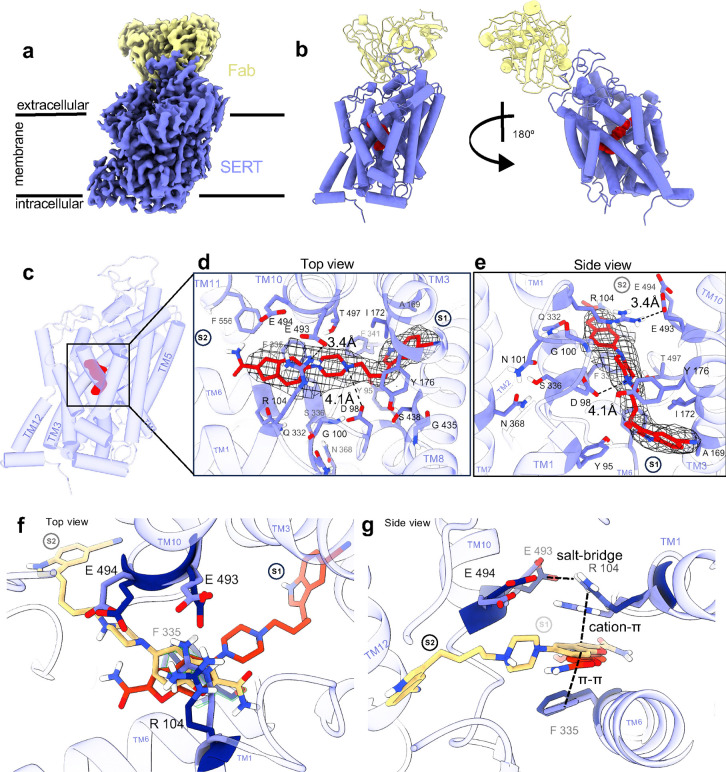
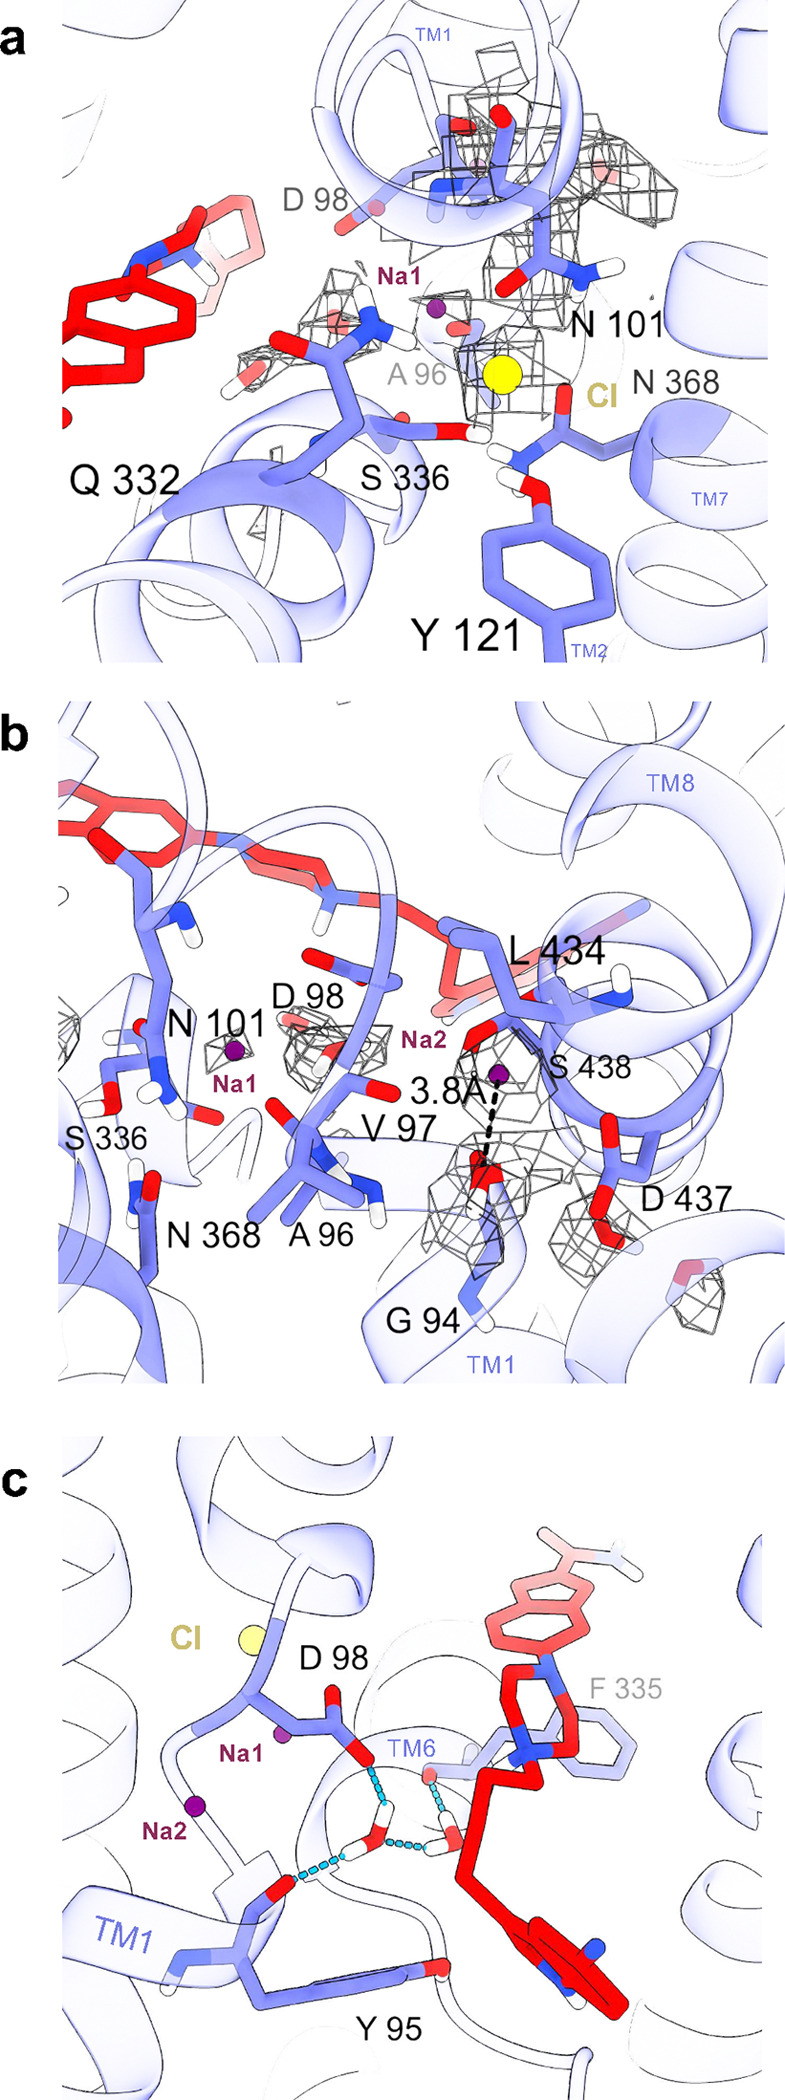
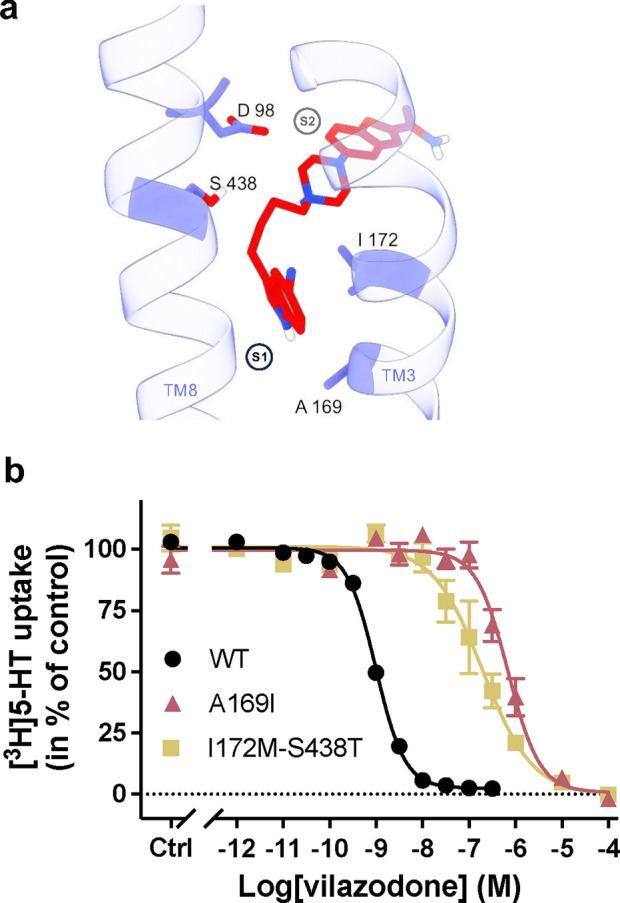
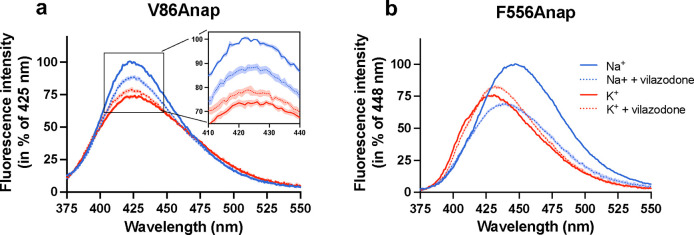
The serotonin transporter (SERT) plays a pivotal role in regulating serotonin (5-HT) signaling and is a key target in treating psychiatric disorders. SERT has a binding site (S1) for 5-HT that also serves as a high-affinity binding site for antidepressants. The antidepressant vilazodone has been shown to inhibit SERT by binding to an allosteric site. Here, we present the cryo-EM structure of SERT with vilazodone bound to the S1 site and extending towards the allosteric site. We systematically dissect the vilazodone molecule into fragments and find that the terminal indole ring is the key determinant for its high affinity to SERT. Further, unlike typical Na+-dependent SERT-selective antidepressants, vilazodone exhibits a dissociation constant (K D) for purified SERT in the nanomolar range both in the presence or absence of Na+. We substantiate this binding mode by exploring the conformational impact of vilazodone binding to SERT using site-specific insertion of the fluorescent non-canonical amino acid Anap. Our results offer novel molecular insight into the distinct pharmacological profile of a clinically used polymodal antidepressant.


Conflict of interest statement

Additional Declarations: There is NO Competing Interest.

Figures

Extended Data Fig. 1:
Extended Data Fig. 1:. Effect of S1 and allosteric site mutants on IC50 for 5-HT and vilazodone.
(a,b) Inhibition of [3H]5-HT uptake by increasing 5-HT concentrations on SERT WT and either (a) allosteric or (b) S1 or S1+allosteric site mutants. Similarly, in (c) and (d), inhibition of [3H]5-HT uptake by increasing vilazodone concentrations on SERT WT and allosteric or S1 and S1+allosteric site mutants, respectively. Experiments performed on intact COS-7 cells transiently transfected with SERT WT or mutants. Data are shown as mean ± S.E.M. (error bars) of n = 3–15 biological replicates performed in triplicates. (e) The inhibitory potency, Hill coefficient and “n” number of individual repeats of 5-HT and vilazodone [3H]5-HT uptake experiments. Data are shown as mean and [S.E. interval] calculated from pIC50 ± S.E. Hill coefficient error bars represent standard error of n = 3–15 values.
Extended Data Fig. 2:
Extended Data Fig. 2:. The SERT-Fab 15B8 complex with vilazodone was isolated in its active form and at a purity level suitable for cryo-EM.
(a) Size exclusion chromatogram (SEC) demonstrating that SERT WT elutes at 10–12 mL fractions in a Superdex 200 increase column. (b) Scintillation proximity assay showing activity of SERT solubilized in GDN binds (S)-citalopram with a KD = 17.7 [10.1; 28.4] nM in equilibrium binding homologous competition experiment. (c) Analytical SEC using vilazodone-bound SERT (blue) eluting at around 10 mL fractions and co-elution of vilazodone-bound SERT with Fab 15B8 (orange) at 10 mL with free Fab 15B8 eluting at 16 mL. (d) Coomassie-stained SDS-PAGE of the SEC elution fractions shown in panel c demonstrating the glycosylated bands of SERT 75–100 kDa and Fab fragment chains at 20–25 kDa. In the second elution (orange) SERT was co-eluted with Fab.
Extended Data Fig. 3:
Extended Data Fig. 3:. Structure determination using cryo-EM.
(a) Workflow of cryo-EM data processing of SERT-Fab15B8-vilazodone complex in the outward-open conformation. The entire data process was performed using CryoSPARC. Details can be found in Methods. (b) Local resolution of the sharpened maps shown as side view and longitudinal section view. (c) Angular distribution of the particles used for the final reconstruction. (d) Gold-standard FSC curves of the final non-uniform refinement. The final resolutions of the cryo-EM maps were determined by the gold-standard with a threshold of 0.143.
Extended Data Fig. 4:
Extended Data Fig. 4:. Representative EM densities of SERT and vilazodone.
(a) Representative EM maps of SERT TMs and EM densities, contoured at 6.2 σ. (b) EM map of fitted vilazodone (red sticks).
Extended Data Fig. 5:
Extended Data Fig. 5:. Comparison of 5-HT-bound and vilazodone bound structures reveal common interaction patterns.
(a) Side view comparison of the 5-HT-bound outward-open (PDB ID: 7LIA) – (5-HT in yellow, SERT in orange), the 5-HT-bound occluded (PDB ID: 7MGW) – (5-HT in cyan, SERT in light blue), and the vilazodone-bound – (vilazodone in red, SERT in purple), SERT structures. Structures are superimposed based on the Cα-carbons in the TMs, excluding the loops. (b) Top view of Panel (a). Comparing the hydrophobic gate and residues K490, Y107, and W103 to the 5-HT-bound structures, the vilazodone-bound SERT adopts an outward-open conformation.
Extended Data Fig. 6:
Extended Data Fig. 6:. Control experiments for the fluorescence equilibrium binding assays using paroxetine and (S)-citalopram.
(a) Paroxetine (magenta circles) and (S)-citalopram (green triangles) binding to SERT coupled with 2nd generation NHS dye (NanoTemper Technologies GmbH, Munich, Germany) in 150 mM Na+ buffer using spectral shift binding isotherm assay at ratio between 670 and 650 nm (fraction bound) using a Dianthus (NanoTemper Technologies GmbH, Munich, Germany) instrument. (b) Binding isotherm (measured ratio of 670 nm / 650 nm) for paroxetine (magenta circles) and (S)-citalopram (green triangles) binding to SERT. Bottom and top plateaus were normalized to 0.0 (no ligand binding) and 1.0 (100 % ligand-bound SERT) fraction resulting in Panel (a). (c) Similar to (b), binding isotherm (measured ratio of 670 nm / 650 nm) for paroxetine (blue circles) and (S)-citalopram (red triangles) dye in 150 mM K+ buffer binding to SERT showing no detectable binding phenomena. (d) Equilibrium dissociation constants KD acquired by Spectral Shift. Data in (a-c)are shown as mean ± S.E.M. (error bars) and in (d) as mean and [S.E. interval] of n = 3 biological replicates, performed in triplicates.
Extended Data Fig. 7:
Extended Data Fig. 7:. Effects of vilazodone on SERT function and Anap fluorescence.
(a) [3H]5-HT uptake for SERT WT (black dotted line), V86Anap (blue squares) and F556Anap (green triangles) following pre-incubation with increasing concentrations of vilazodone. Data are normalized to the uptake obtained in the absence of vilazodone (control) and fitted by a non-linear regression. The IC50 values for V86Anap and F556Anap of 0.91 [0.84; 0.99] nM and 1.42 [1.25; 1.62] nM, respectively, are not significantly different (V86Anap: p = 0.79; F556Anap: p = 0.07) from that of WT (0.99 [0.91; 1.09] nM). The statistical analysis was performed using a using one-way ANOVA with Dunnett multiple comparison correction. (b) Fluorescence emission spectra (360 nm excitation) of 5 nM free Anap incubated in Na+ without (black) and with vilazodone (blue), CDV-3–1 (magenta) or CDV-3–2 (orange). Data are normalized to the fluorescence intensity at λmax (490 nm). Error bars and error envelopes are mean ± S.E.M, n = 3–4. (c) Real-time changes in fluorescence intensity (arbitrary units) at 450 nm for SERT F556Anap pre-equilibrated in 200 mM Na+. Changes are recorded following the application of 100 nM vilazodone (red) or imipramine (blue). Data are normalized to the fluorescence intensity at time 0 and modelled by a one-phase exponential regression. Error envelopes and τ values are mean ± S.E.M., n = 3–5.
Extended Data Fig. 8:
Extended Data Fig. 8:. The inhibitory potency (IC50), Hill coefficient and “n” number of individual repeats of the vilazodone fragments [3H]5-HT uptake experiments.
Data are shown as mean and [S.E. interval] calculated from pIC50 ± S.E. of n = 3 biological replicates, performed in triplicates. IC50 and Hill coefficient data were statistically analyzed with a Dunnett (IC50) and a Tukey (Hill coefficient) multiple comparison test-corrected one-way ANOVA (95% CI, significance set at p < 0.05). *, p <0.05; **, p <0.01; ***, p < 0.001; ****, p < 0.0001 represent significance levels from a Tukey multiple comparison test-corrected one-way ANOVA, comparing the mean to that of the vilazodone. Hill coefficient error bars represent standard error of n = 3 values.
Extended Data Fig. 9:
Extended Data Fig. 9:. Fragments of vilazodone show different binding modes.
a,b,c,d, Emission spectra of SERT V86Anap (a,c) or F556Anap (b,d) following incubation in Na+ (blue) or K+ (red) with (dashed line) or without (solid line) 200 nM CDV-3–1 (a,b) or CDV-3–2 (c,d). Data are normalized to the fluorescence intensities at λmax in Na+ (V86Anap: 425 nm; F556Anap: 448 nm). Error envelopes are mean ± S.E.M., n = 3–5.
Fig. 1:
Fig. 1:. Effect of mutations in the S1 and the allosteric site on vilazodone affinity.
a, A top view of allosterically bound vilazodone (orange) to SERT’s extracellular vestibule (purple ribbons) acquired from the previous cryo-EM structure (PDB ID: 7LWD). The interacting side chains are shown (purple). b,c, The half-maximal inhibitory concentration (IC50) of vilazodone for SERT WT and mutants located at the allosteric site (b), the S1 site, or the combined double mutants (c). The IC50 values are derived from whole-cell [3H]5-HT uptake competition experiments performed on intact COS-7 cells transiently expressing SERT WT or mutants. Mutations showed no significant change in the IC50 values (p > 0.9999) compared to SERT WT except from I172M, N177V, F341V and S438T showing significant change (****, p < 0.0001). The statistical analysis was performed using one-way ANOVA (95% CI, significance set at p < 0.05) with Dunnett multiple comparison correction. Data are shown as mean ± S.E.M. (error bars) of n = 3–5 biological replicates, performed in triplicates. Refer to Extended data Fig. 1 for IC50 curves, calculated IC50 values, and Hill coefficient values.
Fig. 2:
Fig. 2:. Structure of SERT-Fab with vilazodone bound in the S1 site.
a, Cryo-EM density (2.78 Å) of SERT (purple) in complex with the Fab 15B8 fragment (yellow). Estimated positions of membrane phospholipids surrounding SERT are illustrated with black lines. b, The fitted structure of SERT-Fab (purple tube helices) and turned 180° (right). Vilazodone (red spheres) was modeled into a non-protein electron density in the S1 site. c, The fitted SERT structure (purple) in 30% transparency, marking the electron density of vilazodone (red). d, Zoomed-in top view of vilazodone (red sticks) with depicted stabilizing side chain and backbone residues (purple). The electron density for fitting vilazodone is shown as black mesh. e, Side-view of vilazodone binding with SERT stabilizing residues. The S2 site is faded in the background. f,g, Superimposition of the vilazodone complexes in the presence of imipramine (PDB: 7LWD, yellow) and the structure solved herein (red). The constellation of centrally interacting side chain residues shown in dark blue and purple respectively.
Fig. 3:
Fig. 3:. Structure of binding sites for ions and water.
a, Side view of SERT showing the binding sites for Na1 (magenta sphere) and Cl (yellow sphere). The side chains forming the sites are shown (purple sticks). The EM density for ions and N101 are shown as mesh. The EM density of N101 is shown as a reference level corresponding to the density of SERT. Vilazodone is partly shown (red sticks). b, Side view of SERT showing Na1 and Na2 with the EM density as mesh. Resolved water molecules with EM density (mesh) and interacting residues are shown. Vilazodone is in red sticks. c, Side view of SERT showing the hydrogen bonding network between the water molecules and Y95, D98, and F335. Hydrogen bonds, Na1 and Na2, chloride, and vilazodone are shown.
Fig. 4:
Fig. 4:. Key SERT residues involved in the inhibition of SERT by vilazodone.
a, Side view of the TM3 and 8 key residues (D98, A169, I172, S438) forming the vilazodone binding site. b, Measurement of the potency of vilazodone inhibition for SERT WT (black), A169I (red) or I172M-S438T (yellow) mutants. Inhibition potencies were calculated equal to A169I: 690 [510; 1000] nM and I172M-S438T: 200 [110; 370] nM. The two SERT mutants showed significant changes in the IC50 values (****, p < 0.0001) compared to SERT WT. The statistical analysis was performed using one-way ANOVA (95% CI, significance set at p < 0.05), with Dunnett multiple comparison correction. Data are shown as mean ± S.E.M. (error bars) of n = 3–4 biological replicates, performed in triplicates. Refer to Extended data Fig. 1 for IC50 curves and calculated IC50 and Hill coefficient values.
Fig. 5:
Fig. 5:. Fluorescence equilibrium binding show distinct vilazodone affinities in Na+ and K+.
Vilazodone binding to SERT coupled with NHS dye in either 150 mM Na+(black circles) or K+(brown triangles) buffer using spectral shift binding isotherm assay at ratio between 670 and 650 nm (fraction bound). Data are shown as mean ± S.E.M. (error bars) of n = 3 biological replicates, performed in triplicates. Refer to Extended data Fig. 6 for control experiments and calculated KD values.
Fig. 6:
Fig. 6:. Vilazodone induces distinct conformational dynamics in Na+ and K+.
a,b, Fluorescence emission spectra of purified SERT V86Anap (a) or F556Anap (b) excited at 360 nm. Spectra are recorded following incubation in 200 mM Na+ (blue) or K+ (red) with (dashed line) or without (solid line) 200 nM vilazodone. Color legends for a are the same as b. Data are normalized to the fluorescence intensities at λmax in Na+ (V86Anap: 425 nm; F556Anap: 448 nm). Data are shown as mean ± S.E.M. (error envelopes) of n = 3–5 biological replicates.
Fig. 7:
Fig. 7:. Vilazodone fragments reveal structural basis for SERT inhibition potency.
a, The structures of vilazodone and the investigated fragments. The benzofuran, piperazine and indole groups are highlighted with brown boxes. The calculated pKa values included for the two piperazine N-atoms are listed. b, The inhibitory potency of the vilazodone fragments shown in (a) for SERT WT. Data are shown as mean ± S.E.M. (error bars) of n = 3–4 biological replicates, performed in triplicates. Refer to Extended data Fig. 1 for IC50 curves and calculated IC50 and Hill coefficient values.

References

    1. World Health Organization. Depression and Other Common Mental Disorders: Global Health Estimates. World Health Organization; (2017).
    1. Garnock-Jones K. P. & McCormack P. L. Escitalopram: A review of its use in the management of major depressive disorder in adults. CNS Drugs 24, 769–796 (2010). - PubMed
    1. Emslie G. J., Mayes T. L. & Ruberu M. Continuation and maintenance therapy of early-onset major depressive disorder. Pediatric Drugs 7, 203–217 (2005). - PubMed
    1. Pundiak T. M., Case B. G., Peselow E. D. & Mulcare L. Discontinuation of maintenance selective serotonin reuptake inhibitor monotherapy after 5 years of stable response: A naturalistic study. J. Clin. Psychiatry 69, 1811–1817 (2008). - PubMed
    1. Edinoff A. N. et al. Selective serotonin reuptake inhibitors and adverse effects: A narrative review. Neurology International 13, 387–401 (2021). - PMC - PubMed

Publication types

LinkOut - more resources