[Preprint]. 2025 Feb 5:rs.3.rs-5806746.
doi: 10.21203/rs.3.rs-5806746/v1.

Target cell tension regulates macrophage trogocytosis

Affiliations

Target cell tension regulates macrophage trogocytosis

Caitlin E Cornell et al. Res Sq. .

Abstract

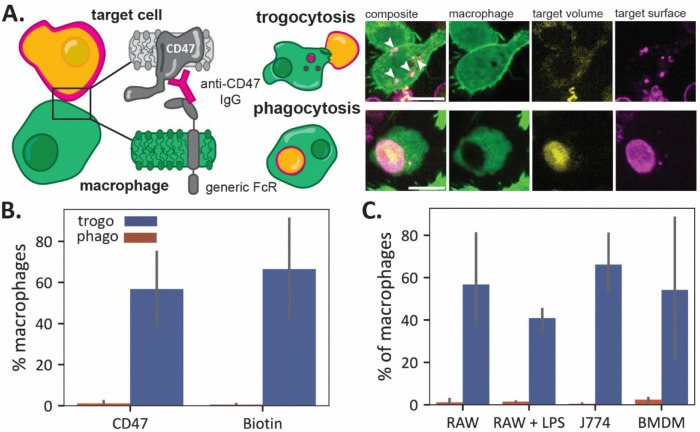
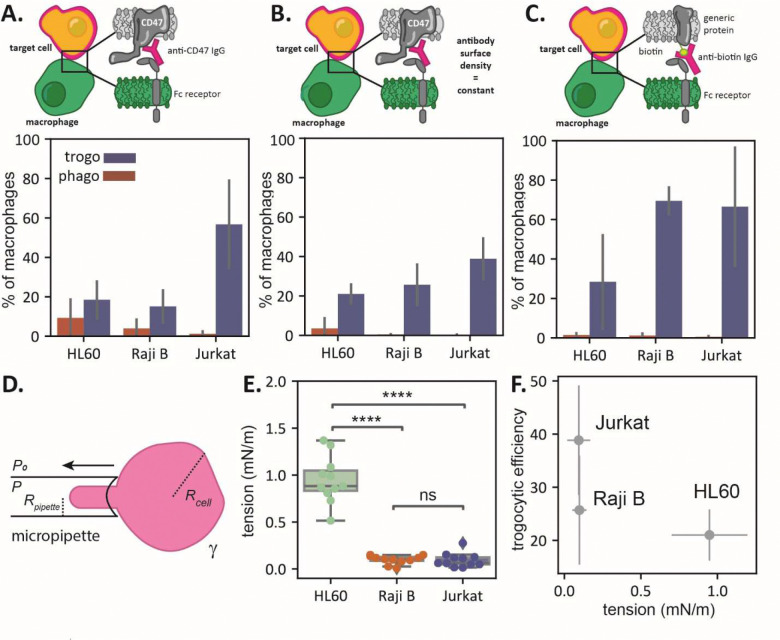
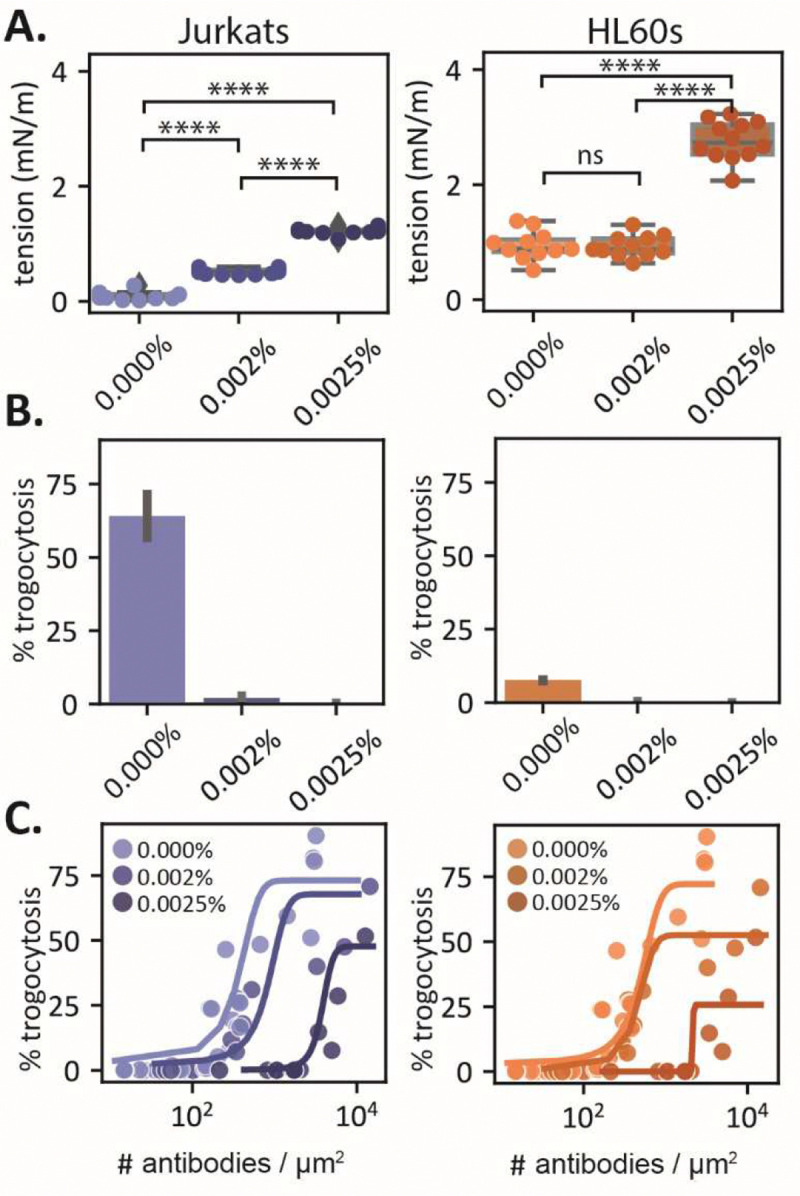
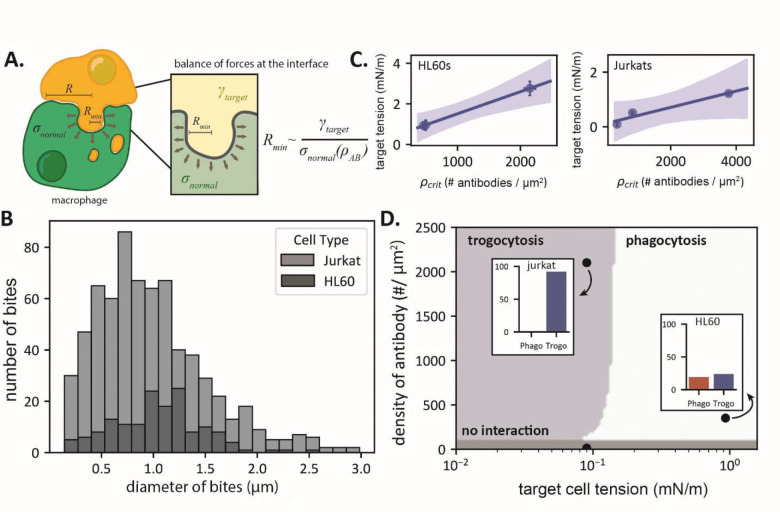
Macrophages are known to engulf small membrane fragments, or trogocytose, target cells and pathogens, rather than fully phagocytose them. However, little is known about what causes macrophages to choose trogocytosis versus phagocytosis. Here, we report that cortical tension of target cells is a key regulator of macrophage trogocytosis. At low tension, macrophages will preferentially trogocytose antibody-opsonized cells, while at high tension they tend towards phagocytosis. Using model vesicles, we demonstrate that macrophages will rapidly switch from trogocytosis to phagocytosis when membrane tension is increased. Stiffening the cortex of target cells also biases macrophages to phagocytose them, a trend that can be countered by increasing antibody surface density and is captured in a mechanical model of trogocytosis. This work suggests that the target cell, rather than the macrophage, determines phagocytosis versus trogocytosis, and that macrophages do not require a distinct molecular pathway for trogocytosis.


Conflict of interest statement

Competing Interests: The authors declare no competing interests.

Figures

Fig. 1.
Fig. 1.. Macrophages trogocytose and phagocytose Jurkat T cells.
(A) Jurkat T cells are labeled with pH-sensitive fluorophore pHrodo and fluorescent (AlexaFluor647) anti-CD47, which binds to the FcR on CellTracker Green CMFDA labeled macrophages, initiating trogocytosis or phagocytosis. Trogocytosis is characterized by internalization of small, punctate ‘bites’ (marked with white arrows) that are positive for the anti-CD47 signal only. Phagocytosis is characterized by colocalization of pHrodo and antibody signal in the phagolysosome of macrophages. The scale bars are 10 μm. (B) Trogocytic and phagocytic efficiency of RAWs challenged with Jurkat T cells for one hour, opsonized with anti-CD47 and anti-biotin, respectively. (C) Trogocytic and phagocytic efficiency of RAW 264.7 cells, BMDMs, J774a.1 cells, and LPS-stimulated RAW 264.7 cells challenged with anti-CD47 opsonized Jurkat T cells. Error bars represent the standard deviation between three biological replicates.
Fig. 2.
Fig. 2.. Trogocytosis depends on cell cortical tension.
(A) Phagocytic and trogocytic efficiency of RAWs challenged with Jurkat T cells, Raji B cells, and HL60s opsonized with anti-CD47 at a solution concentration of 0.04 μM. (B) Phagocytic and trogocytic efficiency of RAWs challenged with Jurkat T cells, Raji B cells, and HL60s opsonized with anti-CD47 solution matched to achieve equivalent surface coverage of antibody (300–500 antibodies/μm2). (C) Phagocytic and trogocytic efficiency of RAWs challenged with Jurkat T cells, Raji B cells, and HL60s with surface proteins non-specifically labeled by NHS-biotin and then opsonized with anti-biotin at a solution concentration of 0.04 μM. Error bars represent the standard deviation between three biological replicates. (D) Micropipette aspiration set up to measure cell tension. We measure Rcell,Rpipette, and P to calculate the surface tension, γ. (E) Tension of Raji B cells, HL60s, and Jurkat T cells. There is a significant difference (computed via one-way ANOVA followed by a Tukey’s pairwise test) between the tension of HL60s and Raji Bs and Jurkat T cells. (F) The trogocytic efficiency of target cells from Fig. 2b is negatively correlated with target cell tension (Pearson’s correlation coefficient of −0.71).
Fig. 3.
Fig. 3.. Macrophages trogocytose GUVs.
(A) GUVs composed of POPC, biotin-DOPE, and liss rho PE are opsonized with AlexaFluor647 anti-biotin and mixed with macrophages. When GUVs are phagocytosed, the perimeter of a circular GUV can be observed within the macrophage phagolysosome (bottom) and when GUVs are trogocytosed, punctate ‘bites’ cab be observed within the macrophage (top). (B) GUVs are trogocytosed more frequently than phagocytosed by macrophages. Error bars represent the standard deviation between three biological replicates. (C) GUVs that are phagocytosed (determined by >50% surface coverage of the GUV by macrophages phagocytic extensions) are in a high-tension regime (>1 mN/m), and GUVs that are trogocytosed (determined by the presence of trogocytic ‘bites’ in the macrophage) are in a low-tension regime (< 1 mN/m). Significance was determined via a student’s T test. (D) Schematic and micrographs of a GUV under low tension getting trogocytosed by a macrophage, followed by application of suction and an increase in tension, leading to full engulfment of the GUV by the macrophage. (E) Time trace of the overlap area between the macrophage channel (green) and the GUV channel (magenta). The dashed red line indicates when suction was applied to the GUV and tension was increased from 0.27 mN/m (trogocytosis regime) to 3.68 mN/m (phagocytosis regime).
Fig. 4.
Fig. 4.. Increasing cell tension via gentle fixation suppresses trogocytosis.
(A) Cell tension measurements for Jurkats and HL60s treated with 0%, 0.02%, and 0.0025% glutaraldehyde. Significance was determined via a one-way ANOVA followed by a Tukey’s pairwise test. (B) Trogocytic efficiency of macrophages challenged with glutaraldehyde-treated target cells. Error bars represent the standard deviation between three biological replicates. (C) Trogocytic efficiency of macrophages challenged glutaraldehyde-treated target cells with a surface density titration of anti-CD47. Sigmoid curves (described in the text) fit to points to guide the eye.
Fig. 5.
Fig. 5.. Mechanical scaling law describing macrophage trogocytosis.
(A) A cartoon model of the macrophage-target interface. (B) Distribution of trogocytic ‘bite’ sizes for macrophages co-cultured with Jurkats (light grey) or HL60s (dark grey) measured from confocal images of macrophages post co-culture. (C) ρcrit scales with the cell tension for treated HL60s and Jurkats. Shaded area corresponds to the 95% confidence interval of the linear fit, computed via bootstrap resampling. Uncertainty on the points in the x-axis represents 95% confidence intervals for the computed inflection point of the sigmoid fits and the standard deviation across cell tension measurements on the y-axis. (D) Approximate phase diagram of macrophage behaviors at different antibody densities and effective membrane tensions based on the scaling law for bite-size. Points correspond to individual measurements at a particular antibody density and cell tension and their corresponding phagocytic and trogocytic efficiencies. Targets in this case are either Jurkat T cells or HL60s.

References

    1. Metchnikoff E. The Evolutionary Biology Papers of Elie Metchnikoff. (Kluwer Academic Publishers, 2000).
    1. Klichinsky M. et al. Human chimeric antigen receptor macrophages for cancer immunotherapy. Nat. Biotechnol. 38, 947–953 (2020). - PMC - PubMed
    1. Mantovani A., Allavena P., Marchesi F. & Garlanda C. Macrophages as tools and targets in cancer therapy. Nat. Rev. Drug Discov. 21, 799–820 (2022). - PMC - PubMed
    1. Pham T., Mero P. & Booth J. W. Dynamics of macrophage trogocytosis of rituximab-coated B cells. PLoS One 6, (2011). - PMC - PubMed
    1. Velmurugan R., Challa D. K., Ram S., Ober R. J. & Ward E. S. Macrophage-mediated trogocytosis leads to death of antibody-opsonized tumor cells. Mol. Cancer Ther. 15, 1879–1889 (2016). - PMC - PubMed

Publication types