. 2025 Jul;87(1):110-129.
doi: 10.1111/his.15434. Epub 2025 Feb 20.

Role of single-nucleotide polymorphism microarray in the classification of BAP1-inactivated melanocytic tumours

Affiliations

Role of single-nucleotide polymorphism microarray in the classification of BAP1-inactivated melanocytic tumours

Joseph S Durgin et al. Histopathology. 2025 Jul.

Abstract

Aims: BAP1-inactivated melanocytic tumours (BIMTs) occur sporadically and in association with a familial tumour predisposition syndrome involving germline mutations in the BRCA1-associated protein-1 (BAP1) gene. Here we report the clinical features, histopathologic findings, and chromosomal copy number data of 19 BAP1-inactivated melanocytomas (BIMs) and compare their features to those of five BAP1-inactivated melanomas.

Methods: We retrospectively searched the Department of Pathology archives and EMERSE (Electronic Medical Record Search Engine) for BIMTs that had undergone single-nucleotide polymorphism (SNP) microarray testing. Clinical history/follow-up data, detailed histopathologic features, and SNP microarray results were recorded.

Results: Overall, four patients (4/13) with BIMs and available clinical history had features suspicious for a germline BAP1 aberration. In BIMs (19 cases), the BAP1-inactivated component showed variable cytologic features, including epithelioid (predominant), rhabdoid, plasmacytoid, and nevoid morphologies. Sentinel lymph node biopsy was negative in all (6/6) patients in which this procedure was performed. No patient diagnosed with a BIM with available clinical follow-up (18/19; mean 38 months) experienced an adverse event. While the histologic appearances of the five melanomas varied, one case resembled a BIM. The median mitotic count was 1/mm2 (range 0-6 mm2) in BIMs compared to 3/mm2 (range 1-4/mm2) in melanomas (P = 0.04). The median number of copy number alterations (CNAs) was two (range 0-6) in indolent cases versus seven (range 6-10) in melanomas (P = 0.0005). The most common molecular aberration after loss of 3p21 was heterozygous loss of the CDKN2A locus, which unlike homozygous loss has not been associated with melanoma.

Conclusion: While most BIMs appear to have a favourable prognosis, even those with multiple CNAs, they deserve careful integration of all clinical and pathologic findings. Although not fully diagnostic, a mitotic count of ≥3/mm2 and ≥6 CNAs in the appropriate context is supportive of a diagnosis of BAP1-inactivated melanoma.

Keywords: BAP1‐inactivated melanocytoma; chromosomal microarray analysis; melanoma; single nucleotide polymorphism microarray.


Conflict of interest statement

The authors report no conflicts of interest.

Figures

Figure 1
Figure 1
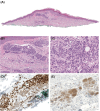
Typical features of BAP1‐inactivated melanocytomas. (A) Case 3. Scanning magnification image showing a dome‐shaped predominantly intradermal melanocytic proliferation with an associated patchy lymphoid infiltrate (H&E, original magnification ×80). (B–E) Cases 1, 3, 7, and 10, respectively. Close inspection reveals epithelioid melanocytes with irregular, pleomorphic nuclei, abundant palely eosinophilic cytoplasm, variable intranuclear inclusions, and distinct cell borders (H&E, original magnifications ×400). [Color figure can be viewed at wileyonlinelibrary.com]
Figure 2
Figure 2
Case 4. (A) Scanning magnification image showing an asymmetric predominantly intradermal melanocytic proliferation that is nested superficially and disperses with dermal descent. (H&E, original magnification ×20). (B) Higher magnification reveals that the composite melanocytes are arranged in large, expansile nests and as single cells (H&E, original magnification ×100). (C) Cytologically, most tumour cells are small, with less cytoplasm that is typically observed in BAP1‐inactived melanocytomas. Many of the cells contain rhabdoid intracytoplasmic inclusions that peripherally displace the nuclei. Scattered smaller nevomelanocytes are seen in the background (H&E, original magnification ×200). (D) BAP1 immunohistochemistry (IHC) revealing a lack of BAP1 nuclear expression in larger melanocytes with retention of expression in background nevus (original magnification ×400). (E) BRAFV600E IHC showing diffuse cytoplasmic expression (original magnification ×400). [Color figure can be viewed at wileyonlinelibrary.com]
Figure 3
Figure 3
Case 5. (A) Scanning magnification image showing an asymmetric predominantly intradermal melanocytic proliferation. A patchy lymphocytic infiltrate is also present. (B) The composite melanocytes consist of large, atypical epithelioid forms as well as smaller nevoid melanocytes that demonstrate variable cytologic atypia. (C,D) Prominent infiltrative and single‐file growth is seen at the base of the lesion. Although the majority of cells are small in size in the deep dermis, occasional large, epithelioid forms are also visualized. (H&E, original magnifications ×100 and ×200). (E) BAP1 immunohistochemistry demonstrates loss of nuclear expression with punctate cytoplasmic staining throughout the lesion and retention in infiltrating inflammatory cells (H&E, original magnification ×400). (F) SNP microarray analysis showing multiple abnormalities, including part of the 3p arm (3p26.3 – p14.1) containing the BAP1 locus, part of 3q, entire chromosome 9 (but without CDKN2A/CDKN2B homozygous loss), entire chromosome 10 (subset, ~10% of cells), and gain of entire chromosome 16 (subset, ~10% of cells). [Color figure can be viewed at wileyonlinelibrary.com]
Figure 4
Figure 4
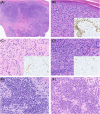
Case 8. (A) Low‐magnification image showing a biphenotypic and asymmetric intradermal proliferation of melanocytes (H&E, original magnification ×40). (B) Closer inspection reveals that the majority of the cells are arranged in sheets and show abundant grey cytoplasm with numerous associated melanophages. Smaller cells present in tight nests and resembling ordinary nevus are also present (H&E, original magnification ×200). (C) High magnification reveals vesicular nuclei with variably prominent nucleoli in the epithelioid population. (H&E, original magnification ×400). (D) BAP1 immunohistochemistry (IHC) showing loss of expression in both populations (original magnification ×400). (E) HMB‐45 IHC showing strong and diffuse staining in the epithelioid component, which is absent in cells resembling ordinary nevus (original magnification ×200). (F) β‐catenin IHC showing strong cytoplasmic and nuclear expression in the larger melanocytes with membranous expression in cells resembling ordinary nevus (H&E, original magnification ×400). [Color figure can be viewed at wileyonlinelibrary.com]
Figure 5
Figure 5
Case 1M. (A) Scanning magnification image of the foot lesion reveals a predominantly intradermal neoplasm with regions of expansile growth superficially and extension into the deep dermis (H&E, original magnification ×46). (B) Higher magnification reveals the presence of a pleomorphic epithelioid component typical of BAP1‐inactivated melanocytomas (H&E, original magnification ×400). BAP1 immunohistochemistry (IHC; inset) showing loss of expression in this component (original magnification ×400). (C) A banal nevoid population (H&E), also BAP1‐inactivated by IHC (inset), is identified in the background (original magnifications ×400). (D) Also within the dermis and comprising the majority of the tumour is a distinct, highly cellular population of cytologically monotonous, moderately sized melanocytes with BAP1 IHC (inset) also showing diffuse loss of expression (original magnifications ×400). (E) Histologic evaluation of the ankle lesion revealed an intradermal population of melanocytes closely resembling the monotonous, moderately sized population in the prior left foot specimen (H&E, original magnification ×400). Expression of BAP1 was diffusely lost. (F) Histologic evaluation of the malleolus specimen also showed a similar population of melanocytes, again closely resembling the prior two specimens with diffuse loss of BAP1 staining (H&E, original magnification ×400). [Color figure can be viewed at wileyonlinelibrary.com]

References

    1. Shain AH, Yeh I, Kovalyshyn I et al. The genetic evolution of melanoma from precursor lesions. N Engl J Med 2015; 373; 1926–1936. - PubMed
    1. Alomari AK, Miedema JR, Carter MD et al. DNA copy number changes correlate with clinical behavior in melanocytic neoplasms: proposal of an algorithmic approach. Mod Pathol 2020; 33; 1307–1317. - PubMed
    1. WHO Classification of Tumours Editorial Board . Skin tumours [Internet; beta version ahead of print]. Lyon (France): International Agency for Research on Cancer 2023; (WHO classification of tumours series, 5th ed.; vol. 12). Available from: https://tumourclassification.iarc.who.int/chapters/64.
    1. Andea AA. Molecular testing for melanocytic tumors: a practical update. Histopathology 2022; 80; 150–165. - PubMed
    1. Wiesner T, Murali R, Fried I et al. A distinct subset of atypical Spitz tumors is characterized by BRAF mutation and loss of BAP1 expression. Am J Surg Pathol 2012; 36; 818–830. - PMC - PubMed