. 2025 Apr;12(15):e2412903.
doi: 10.1002/advs.202412903. Epub 2025 Feb 20.

Targeting Histone Deacetylase 11 with a Highly Selective Inhibitor for the Treatment of MASLD

Affiliations

Targeting Histone Deacetylase 11 with a Highly Selective Inhibitor for the Treatment of MASLD

Feng Zhang et al. Adv Sci (Weinh). 2025 Apr.

Abstract

Metabolic dysfunction-associated steatotic liver disease (MASLD) represents the most prevalent chronic liver disorder globally. Due to its intricate pathogenesis and the current lack of efficacious pharmacological interventions, there is a pressing need to discover novel therapeutic targets and agents for MASLD treatment. Herein, it is found that histone deacetylase 11 (HDAC11), a subtype of HDAC family, is markedly overexpressed in both in vitro and in vivo models of MASLD. Furthermore, the knockdown of HDAC11 is observed to mitigate lipid accumulation in hepatic cells. A highly selective HDAC11 inhibitor, B6, which exhibits favorable pharmacokinetic property and liver distribution, is further designed and synthesized. Integrating RNA-seq data with in vivo and in vitro experiments, B6 is found to inhibit de novo lipogenesis (DNL) and promote fatty acid oxidation, thus mitigating hepatic lipid accumulation and pathological symptoms in MASLD mice. Further omics analysis and experiments reveal that B6 enhances the phosphorylation of AMPKα1 at Thr172 through the inhibition of HDAC11, consequently modulating DNL and fatty acid oxidation in the liver. In summary, this study identifies HDAC11 as a potential therapeutic target in MASLD and reports the discovery of a highly selective HDAC11 inhibitor with favorable drug-like properties for the treatment of MASLD.

Keywords: AMP‐activated protein kinase; de novo lipogenesis; fatty acid oxidation; histone deacetylase 11; metabolic dysfunction‐associated steatotic liver disease.


Conflict of interest statement

The authors declare no conflict of interest.

Figures
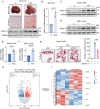
Figure 1
Figure 1
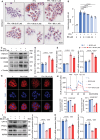
HDAC11 is involved in lipid accumulation in vivo and in vitro. A) Liver and Oil Red O staining images of mice, and hepatic HDAC11 protein expression (n = 6). B) mRNA expression of HDAC11 of mice liver (n = 6). C–F) Protein and mRNA expression of HDAC11 in FFA‐induced HepG2 and AML12 cells (n = 3 biological replicates). G) Oil Red O staining of HepG2 cells transfected with siHDAC11 and quantitative analysis. The experiment was conducted independently on three occasions. H) Volcano plot of differential gene expression between the FFA_siHDAC11 and FFA_siNC groups of HepG2 cells (n = 3). I) Heatmap analysis of bulk RNA‐seq data between the FFA_siHDAC11 and FFA_siNC groups of HepG2 cells (n = 3). Data are shown as mean ± SD. The p‐values were calculated by two‐tailed Student's t‐test.
Figure 2
Figure 2
Discovery of HDAC11 selective inhibitor B6. A) Chemical structure of B6. B) Schematic depiction of the fluorescence assay for in vitro HDAC11 inhibition. C) IC 50 values for the inhibitory activity of B6 against HDAC1‐11 and SIRT2. Data are shown as mean ± SEM. D) IC 50 curves of B6 against HDAC1‐11 and SIRT2. The experiment was conducted independently on two occasions. Data are shown as mean ± SEM. E) Schematic depiction of the click chemistry of experiment to assess the myristoylation of SHMT2 influenced by B6. The myristoylation of SHMT2 was detected by immunoblotting in HEK293T cells treated with vehicle control (–) or 0.25, 0.5, and 1 × 10⁻⁶ m B6 for 24 h (n = 3 biological replicates). F) The acetylation of histone H3, histone H4, and α‐tubulin in HEK293T cell after treatment of compounds B6 and SAHA at the concentrations of 0.25, 0.5, and 1 × 10⁻⁶ m for 24 h (n = 3 biological replicates).
Figure 3
Figure 3
A) Compound modification strategy and chemical structure of A8 and B1B8. B) IC 50 values for the inhibitory activity of A8, B1B8, and SIS17 against HDAC11. The values were obtained from three independent experiments; data are shown as mean ± SEM. C) IC 50 curves of B1B8 and SIS17 against HDAC11.
Figure 4
Figure 4
Pharmacokinetic and tissue distribution study of B6. A) Pharmacokinetic parameters of B6 in ICR mice. B6 was administrated via i.v. and p.o. (n = 3). B) The curves represent the AUC of plasma concentration versus time for B6 following i.v. and p.o. at different time points (n = 3). C) The AUC values of concentration for B6 were determined in blood, heart, liver, spleen, lung, and kidney tissues at 0.17, 0.5, and 1 h after administration (i.p. at 5 mg kg−1) (n = 3). Data are shown as mean ± SD.
Figure 5
Figure 5
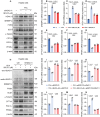
Effects of B6 on de novo lipogenesis and fatty acid oxidation in AML12 cells. A,B) Oil Red O staining and optical density of AML12 cells treated with B6 of different concentration for 24 h. The experiment was conducted independently on four occasions. C) Protein expression of HDAC11, SREBP1c, FASN, SCD1, and HSP90 of HepG2 cells treated with FFA and 0.5 × 10⁻⁶ m B6 for 24 h (n = 3 biological replicates). D–F) Relative normalized mRNA expression of SREBP1c, FASN, and SCD1 of indicated cells (n = 4 biological replicates). mRNA level of β‐actin was used as normalized control. G) Mito‐Tracker Deep Red FM staining of indicated cells. The experiment was conducted independently on three occasions. H) Mitochondrial oxygen consumption rate in indicated cells (n = 3 biological replicates). I) Protein expression of CPT1A, PGC1α, PPARα, and HSP90 in indicated cells (n = 3 biological replicates). J–L) Relative normalized mRNA expression of CPT1A, PGC1α, and PPARα of indicated cells (n = 4 biological replicates). mRNA level of β‐actin was used as normalized control. Data are shown as mean ± SD. The p‐values were calculated by one‐way ANOVAs.
Figure 6
Figure 6
B6 reduces de novo lipogenesis and promotes fatty acid oxidation through HDAC11. A) Protein expression of HDAC11, SREBP1c, FASN, SCD1, α‐Tubulin, CPT1A, PGC1α, PPARα, and HSP90 of HepG2 cells transfected with siHDAC11 and treated with 0.5 × 10⁻⁶ m B6 for 24 h (n = 3 biological replicates). B–G) Relative normalized mRNA expression of SREBP1c, FASN, SCD1, CPT1A, PGC1α, and PPARα of indicated cells (n = 4 biological replicates). mRNA level of β‐actin was used as normalized control. H) Protein expression of exo‐HDAC11, endo‐HDAC11, SREBP1c, FASN, SCD1, α‐Tubulin, CPT1A, PGC1α, PPARα, and β‐actin of HepG2 cells transfected with pEGFP‐C2‐hHDAC11 and treated with 0.5 × 10⁻⁶ m B6 for 24 h (n = 3 biological replicates). I–N) Relative normalized mRNA expression of SREBP1c, FASN, SCD1, CPT1A, PGC1α, and PPARα of indicated cells (n = 4 biological replicates). mRNA level of β‐actin was used as normalized control. Data are shown as mean ± SD. The p‐values were calculated by one‐way ANOVAs.
Figure 7
Figure 7
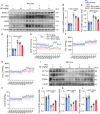
Effects of B6 on mice fed with high fat diet. A) Schematic diagram of animal experiments. B) Weight change and fat mass of mice (n = 8). C) Images of mice and livers, and H&E and Oil red O staining of mice liver (n = 8). D,E) The fat mass and liver weight of mice (n = 8). F–H) Hepatic TG, TC, and FFA levels of mice (n = 8). Data are shown as mean ± SD. The p‐values were calculated by one‐way ANOVAs.
Figure 8
Figure 8
Effects of B6 on serum indexes in mice fed with high fat diet. A–H) Serum ALT, AST, ALP, TG, NEFA, CHO, LDL‐C, and HDL‐C levels (n = 8). I,J) Glucose tolerance test and insulin tolerance test of mice (n = 5). Data are shown as mean ± SD. The p‐values were calculated by one‐way ANOVAs.
Figure 9
Figure 9
B6 reduces de novo lipogenesis, increases energy consumption, and promotes fatty acid oxidation in HFD mice. A) Protein expression of HDAC11, SREBP1c, FASN, SCD1, and HSP90 of mice liver (n = 8). B–D) Relative normalized mRNA expression of Srebp1c, Fasn, and Scd1 in mice liver (n = 8). mRNA level of β‐actin was used as normalized control. E–H) Respiratory exchange ratio, O2 consumption, CO2 production, and heat production levels of mice (n = 5). I) Protein expression of CPT1A, PGC1α, PPARα, and HSP90 of mice liver (n = 8). J–L) Relative normalized mRNA expression of Pgc1α, Cpt1a, and Pparα in mice liver (n = 8). mRNA level of β‐actin was used as normalized control. Data are shown as mean ± SD. The p‐values were calculated by one‐way ANOVAs.
Figure 10
Figure 10
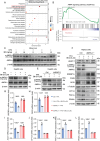
B6 reduces de novo lipogenesis and promotes fatty acid oxidation by regulating phosphorylation of AMPKα1 through inhibiting HDAC11. A) Top 20 of total differential gene KEGG enrichment pathway between the FFA_siHDAC11 and FFA_siNC groups of HepG2 cells (n = 3). B) GSEA enrichment analysis graphs of AMPKα signaling pathway between the FFA_siHDAC11 and FFA_siNC groups of HepG2 cells (n = 3). C) Protein expression of p‐AMPKα (Thr172), AMPKα, and HSP90 of mice liver (n = 8). D) Protein expression of p‐AMPKα (Thr172), AMPKα, and HSP90 of HepG2 cells treated with FFA and 0.5 × 10⁻⁶ m B6 for 24 h (n = 3 biological replicates). E) Protein expression of p‐AMPKα (Thr172), AMPKα, and α‐Tubulin of HepG2 cells transfected with pEGFP‐C2‐hHDAC11 and treated with 0.5 × 10⁻⁶ m B6 for 24 h (n = 3 biological replicates). F) Protein expression of HDAC11, p‐AMPKα (Thr172), AMPKα, SREBP1c, FASN, SCD1, CPT1A, PGC1α, PPARα, and HSP90 of AMPKα1−/− HepG2 cells treated with FFA and 0.5 × 10⁻⁶ m B6 for 24 h (n = 3 biological replicates). G–L) Relative normalized mRNA expression of SREBP1c, FASN, SCD1, CPT1A, PGC1α, and PPARα of indicated cells (n = 4 biological replicates). mRNA level of β‐actin was used as normalized control. Data are shown as mean ± SD. The p‐values were calculated by one‐way ANOVAs.
Figure 11
Figure 11
B6 reduces de novo lipogenesis and promote fatty acid oxidation by modulating phosphorylation of AMPKα1 Thr172 through inhibiting HDAC11. A) Protein expression of HDAC11, exo‐p‐AMPKα (Thr172), exo‐AMPKα, SREBP1c, FASN, SCD1, α‐Tubulin, CPT1A, PGC1α, PPARα, and β‐actin of HepG2 cells transfected with AMPKα1‐WT and AMPKα1‐T172A, and treated with 0.5 × 10⁻⁶ m B6 for 24 h (n = 3 biological replicates). B–J) Relative normalized mRNA expression of SREBP1c, FASN, SCD1, CPT1A, PGC1α, PPARα, LKB1, CaMKKβ, and TAK1 of indicated cells. mRNA level of β‐actin was used as normalized control (n = 4 biological replicates). K) Protein expression of p‐LKB1, LKB1, and HSP90 of HepG2 cells treated with FFA and 0.5 × 10⁻⁶ m B6 for 24 h (n = 3 biological replicates). L) Protein expression of p‐LKB1, LKB1, and HSP90 of HepG2 cells transfected with pEGFP‐C2‐hHDAC11 and treated with 0.5 × 10⁻⁶ m B6 for 24 h (n = 3 biological replicates). M) Relative normalized mRNA expression of LKB1 of indicated cells (n = 4 biological replicates). mRNA level of β‐actin was used as normalized control. N) Scheme of B6 in alleviating NAFLD. B6 inhibits HDAC11 and enhances phosphorylation of AMPKα1 Thr172, thereby alleviating de novo lipogenesis and promoting fatty acid oxidation in progression of NAFLD. Data are shown as mean ± SD. The p‐values were calculated by one‐way ANOVAs.

Similar articles

References

    1. a) Friedman S. L., Neuschwander‐Tetri B. A., Rinella M., Sanyal A. J., Nat. Med. 2018, 24, 908; - PMC - PubMed
    2. b) Byrne C. D., Targher G., J. Hepatol. 2015, 62, S47. - PubMed
    1. Younossi Z., Anstee Q. M., Marietti M., Hardy T., Henry L., Eslam M., George J., Bugianesi E., Nat. Rev. Gastroenterol. Hepatol. 2018, 15, 11. - PubMed
    1. a) Zeigerer A., Mol. Metab. 2021, 50, 101274; - PMC - PubMed
    2. b) Febbraio M. A., Reibe S., Shalapour S., Ooi G. J., Watt M. J., Karin M., Cell Metab. 2019, 29, 18. - PMC - PubMed
    1. Badmus O. O., Hillhouse S. A., Anderson C. D., Hinds T. D., Stec D. E., Clin. Sci. 2022, 136, 1347. - PMC - PubMed
    1. Sanders F. W., Griffin J. L., Biol. Rev. Cambridge Philos. Soc. 2016, 91, 452. - PMC - PubMed

Substances

LinkOut - more resources