. 2025 May;12(17):e2411235.
doi: 10.1002/advs.202411235. Epub 2025 Feb 20.

SIRT3-Mediated Deacetylation of DRP1K711 Prevents Mitochondrial Dysfunction in Parkinson's Disease

Affiliations

SIRT3-Mediated Deacetylation of DRP1K711 Prevents Mitochondrial Dysfunction in Parkinson's Disease

Ye Xi et al. Adv Sci (Weinh). 2025 May.

Abstract

Dysregulation of mitochondrial dynamics is a key contributor to the pathogenesis of Parkinson's disease (PD). Aberrant mitochondrial fission induced by dynamin-related protein 1 (DRP1) causes mitochondrial dysfunction in dopaminergic (DA) neurons. However, the mechanism of DRP1 activation and its role in PD progression remain unclear. In this study, Mass spectrometry analysis is performed and identified a significant increased DRP1 acetylation at lysine residue 711 (K711) in the mitochondria under oxidative stress. Enhanced DRP1K711 acetylation facilitated DRP1 oligomerization, thereby exacerbating mitochondrial fragmentation and compromising the mitochondrial function. DRP1K711 acetylation also affects mitochondrial DRP1 recruitment and fission independent of canonical S616 phosphorylation. Further analysis reveals the critical role of sirtuin (SIRT)-3 in deacetylating DRP1K711, thereby regulating mitochondrial dynamics and function. SIRT3 agonists significantly inhibit DRP1K711 acetylation, rescue DA neuronal loss, and improve motor function in a PD mouse model. Conversely, selective knockout of SIRT3 in DA neurons exacerbates DRP1K711 acetylation, leading to increased DA neuronal damage, neuronal death, and worsened motor dysfunction. Notably, this study identifies a novel mechanism involving aberrant SIRT3-mediated DRP1 acetylation at K711 as a key driver of mitochondrial dysfunction and DA neuronal death in PD, revealing a potential target for PD treatment.

Keywords: DRP1K711; Parkinson's disease; SIRT3; acetylation; mitochondrial dysfunction; oxidative stress.


Conflict of interest statement

The authors declare no conflict of interest.

Figures

Figure 1
Figure 1
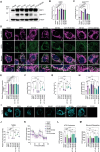
Enhanced K711 acetylation of DRP1 in mitochondria under oxidative stress. A) SH‐SY5Y cells were treated with 300 µM H2O2 for 18 h. Cytoplasmic and mitochondrial fractions were isolated and subjected to western blotting analysis to determine the acetylation levels in the indicated groups. Data are represented as the mean ± standard deviation (SD) (n = 3). *P < 0.05 and **P < 0.01 versus indicated group. B) Categorization of 112 acetylated proteins identified via mass spectrometry (MS) in H2O2‐treated SH‐SY5Y cells. C,D) MS analysis of K711 acetylation of DRP1 in the mitochondria and the list of the top four results based on pepcounts from mass spectrometry analysis. E) Antibody dot blot assay: Different doses of modified and unmodified peptides were immobilized onto a solid phase membrane and incubated with the antibody K711Ac, and binding between the peptides and antibody was analyzed. Dot blot results showed that the peptides exhibited over tenfold higher signal recognition for the modified peptide than for the unmodified peptide. F) SH‐SY5Y cells were treated with 300 µM H2O2 for 18 h. Acetylation level of DRP1 was measured via immunoprecipitation. Data are represented as the mean ± SD (n = 3). *P < 0.05 versus indicated group. G) SH‐SY5Y cells were treated with 300 µM H2O2 for 18 h. Analysis of DRP1K711 expression via immunoprecipitation. Data are represented as the mean ± SD (n = 3). **P < 0.01 versus indicated group. H) DRP1 acetylation level in PD patient‐derived hiPSCs via immunoprecipitation. Data are represented as the mean ± SD (n = 3). *P < 0.05 versus indicated group. I) DRP1K711 level in PD patient‐derived hiPSCs via immunoprecipitation. Data are represented as the mean ± SD (n = 3). *P < 0.05 and **P < 0.01 versus indicated group. Statistical analysis results are presented in Table S1 (Supporting Information).
Figure 2
Figure 2
K711 acetylation of DRP1 alters the mitochondrial morphology and functions. A) Schematic representation of DRP1 structural domains, highlighting the K711 acetylation site. Monomeric and dimeric forms are shown. The monomeric and dimeric forms were simulated using software, based on the structures retrieved from the UniProt database. B,C) Western blotting analysis of DRP1 monomer and oligomer expression levels in HeLa cells transfected with the K711R and K711Q mutant plasmids. Data are represented as the mean ± SD (n = 3). *P < 0.05, **P < 0.01, ***P < 0.001, and ****P < 0.0001 versus indicated group. D–F) Mitochondrial morphology in HeLa cells transfected with the K711R and K711Q mutant plasmids was visualized via MitoTracker staining. The staining results were then analyzed to explore potential changes in mitochondrial shape and distribution caused by the K711R and K711Q mutant plasmids. **P < 0.01 and ***P < 0.001 versus indicated group. D) Representative images. E) Quantification of mitochondrial length and aspect ratio (AR, ratio between the major and minor axis of the ellipse equivalent to the mitochondrion). F) Quantification of mitochondrial form factor (FF, defined as [Pm2]/[4πAm], where Pm is the length of mitochondrial outline, and Am is the area of mitochondrion). Scale bars: 10 µm; 2.5 µm (zoomed regions). Data are represented as the mean ± SD (n = 6). **P < 0.01 and ***P < 0.001 versus indicated group. G–I) Oxygen consumption rate (OCR) analysis of ATP production levels and maximal respiratory capacity in HeLa cells transfected with the K711R and K711Q mutant plasmids. Data are represented as the mean ± SD (n = 3). *P < 0.05, ***P < 0.001 and ****P < 0.0001 versus indicated group. J–L) Mitochondrial morphology analysis of HeLa cells transfected with the K711R and K711Q mutant plasmids after treatment with 100 or 300 µM H2O2. J) Representative images. K) Quantification of mitochondrial AR. L) Quantification of mitochondrial FF. Scale bar: 10 µm. Data are represented as the mean ± SD (n = 3). *P < 0.05, **P < 0.01, ***P < 0.001, and ****P < 0.0001 versus indicated group. M,N) CellROX Deep Red staining of reactive oxygen species (ROS) generation in HeLa cells transfected with the K711R and K711Q mutant plasmids after treatment with 100 or 300 µM H2O2. M) Representative images. N) Quantification of ROS levels. Scale bar: 100 µm. Data are represented as the mean ± SD (n = 3). ***P < 0.001 and ****P < 0.0001 versus indicated group. Statistical analysis results are presented in Table S1 (Supporting Information).
Figure 3
Figure 3
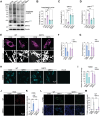
K711 acetylation of DRP1 regulates the mitochondrial morphology and functions synergistically with S616‐induced fission. A–C) Western blotting analysis of DRP1 and phosphorylated DRP1 (S616) levels in HeLa cells transfected with plasmids encoding wild‐type DRP1, K711R, K711Q, S616D and K711R S616D. Data are represented as the mean ± SD (n = 3). *P < 0.05 and ****P < 0.0001 versus indicated group; ns, not significant. D–H) Immunofluorescence microscopy showing the effects of distinct DRP1 variants (wild‐type DRP1, K711R, K711Q, S616D, K711R S616D, S616A, and K711Q S616A) on mitochondrial morphology (visualized using Mito‐RFP), DRP1 levels and the co‐labeling of DRP1 and mitochondria in HeLa cells. D) Representative images. E) Quantification of DRP1 expression levels. F) Quantification of the morphological index AR of mitochondrial. G) Quantification of the morphological index FF of mitochondria. H) Quantification of DRP1 co‐localization in mitochondria. Scale bar: 10 µm. Data are represented as the mean ± SD (n = 3–6). *P < 0.05, **P < 0.01, ***P < 0.001 and ****P < 0.0001 versus indicated group; ns, not significant. I,J) Mitochondrial membrane potential (ΔΨm) in HeLa cells expressing DRP1 variants assessed via TMRE staining. ** P < 0.01, ***P < 0.001 and ****P < 0.0001 versus indicated group; ns, not significant. K–M) Oxygen consumption rate (OCR) analysis of the effects of distinct DRP1 variants on ATP production and maximal respiratory capacity in HeLa cells. Data are represented as the mean ± SD (n = 4). *P < 0.05, **P < 0.01, ***P < 0.001, and ****P < 0.0001 versus indicated group; ns, not significant. Statistical analysis results are presented in Table S1 (Supporting Information).
Figure 4
Figure 4
SIRT‐3 regulates mitochondrial function and morphology via K711 acetylation of DRP1. A) Co‐immunoprecipitation assay showing the interaction between DRP1 and SIRT3 in HeLa cells. B) Bimolecular fluorescence complementation (BiFC) assay confirmed the interaction between DRP1 and SIRT3 in HeLa cells. Fusion constructs of DRP1‐HA and SIRT3‐FLAG were co‐expressed, and green fluorescence indicates protein interaction. Scale bar: 20 µm. C) The schematic diagram of the FLIM – FRET experiment principle for CFP – DRP1 and YFP – SIRT3. Representative images showing the lifetime distribution. D)Time‐correlated single‐photon counting‐fluorescence lifetime imaging microscopy (TCSPC FLIM) with Förster resonance energy transfer (FRET) further confirmed the interaction between DRP1 and SIRT3. Comparison of the decay data and fitting curves of cells expressing CFP alone and those co‐expressing CFP and EYFP confirmed FRET, indicating the interaction between DRP1 and SIRT3. Scale bar: 0.03 mm. E) Co‐immunoprecipitation experiments using shSIRT3 or SIRT3‐overexpressing cell lines co‐transfected with DRP1‐Flag revealed the regulatory role of SIRT3 in DRP1 acetylation. F–H) Western blotting analysis showing the impact of SIRT3 overexpression or knockdown on the acetylation levels of DRP1 at K711 in HeLa cells under the condition of H₂O₂‐induced oxidative stress. Data are represented as the mean ± SD (n = 3). *P < 0.05, **P < 0.01, ***P < 0.001, and ****P < 0.0001 versus indicated group; ns, not significant. I) After being co‐transfected with the SIRT3 and K711Q plasmids, the CCK‐8 assay was conducted to show the protective effects of SIRT3 against H₂O₂‐induced cell death in HeLa cells. Data are represented as the mean ± SD (n = 6). *P < 0.05, **P < 0.01, ***P < 0.001, and ****P < 0.0001 versus indicated group; ns, not significant. J–M) After being co‐transfected with the SIRT3 and K711Q plasmids and subsequently treated with H₂O₂, Western blotting analysis was performed to detect the expression levels of cleaved caspase‐3, Bax, and Bcl‐2 in HeLa cells, which confirmed the protective effects of SIRT3 against H₂O₂‐induced apoptosis in HeLa cells. Data are represented as the mean ± SD (n = 3). *P < 0.05, **P < 0.01, ***P < 0.001, and ****P < 0.0001 versus indicated group; ns, not significant. N,O) Immunofluorescence staining with Tom20 antibody revealed the impact of SIRT3 on mitochondrial morphology in HeLa cells. Quantification of mitochondrial AR and FF is shown. Scale bar: 10 µm. Data are represented as the mean ± SD (n = 3). *P < 0.05, **P < 0.01, ***P < 0.001, and ****P < 0.0001 versus indicated group; ns, not significant. Statistical analysis results are presented in Table S1 (Supporting Information).
Figure 5
Figure 5
SIRT3 protects against MPP+‐induced apoptosis by regulating DRP1K711 acetylation. A–D) Western blotting analysis of the effects of SIRT3 overexpression on acetylated lysine, DRP1K711, and SIRT3 levels in SH‐SY5Y cells after MPP+ treatment. Data are represented as the mean ± SD (n = 3). *P < 0.05, **P < 0.01, and ***P < 0.001 versus indicated group; ns, not significant. E–G) Mitochondrial morphology in SH‐SY5Y cells after MPP+ treatment was assessed via MitoTracker staining. Quantification of mitochondrial AR and FF is shown. Scale bars: 10 µm; 5 µm (zoomed). Data are represented as the mean ± SD (n = 3). *P < 0.05 and **P < 0.01 versus indicated group; ns, not significant. H,I) Mitochondrial membrane potential (ΔΨm) in SH‐SY5Y cells after MPP+ treatment evaluated via TMRE staining. Scale bar: 10 µm. Data are represented as the mean ± SD (n = 3). **P < 0.01 and ***P < 0.001 versus indicated group. J,K) ROS generation in MPP+ treated SH‐SY5Y cells assessed via CellROX Deep Red staining. Scale bar: 80 µm. Data are represented as the mean ± SD (n = 3). ***P < 0.001 and ****P < 0.0001 versus indicated group. L) TUNEL analysis of MPP+ treated SH‐SY5Y cell apoptosis. Scale bar: 160 µm. M) Quantification of TUNEL‐positive cells. Data are represented as the mean ± SD (n = 3). ***P < 0.001 versus indicated group. Statistical analysis results are presented in Table S1 (Supporting Information).
Figure 6
Figure 6
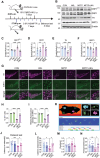
DRP1K711 acetylation induces mitochondrial and neuronal damage with motor deficits in mice. A) Illustration of generating TH‐specific DRP1K711Q overexpression mice through stereotaxic virus injection into the SNc of TH‐cre mice. Immunofluorescence staining images were presented to show the injection site for confirmation of the targeted area. Scale bars: 100 µm. B–D) Western blotting analysis of TH and DRP1K711 levels in the SNc brain tissues of DRP1K711Q overexpression mice. Data are represented as the mean ± SD (n = 6). *P < 0.05 and ****P < 0.0001 versus indicated group; ns, not significant. E,F) Immunofluorescence staining and analysis of TH expression levels in the SNc region of DRP1K711Q overexpression mice. Data are represented as the mean ± SD (n = 3). **P < 0.01 versus indicated group. Scale bars: 100 µm. G–I) Electron microscopy analysis of mitochondria morphology in the SNc brain tissues of DRP1K711Q overexpression mice. Quantification of mitochondrial AR and Vacuoles% is shown. Data are represented as the mean ± SD (n = 3). **P < 0.01 versus indicated group. Scale bars: 1 µm. J–N) Motor behavioral tests of DRP1K711Q overexpression mice. J) Rotarod test analysis of motor function. Data are represented as the mean ± SD (n = 7). ns, not significant. K) Test diagram from the Catwalk system. The system shows green paw prints and records parameters after recognition. L–N) Catwalk gait analysis of cadence, duration, and average speed. Data are represented as the mean ± SD (n = 7). *P < 0.05 and **P < 0.01 versus indicated group.
Figure 7
Figure 7
SIRT3 agonist HKL protects dopaminergic neurons and alleviates motor dysfunction in the MPTP‐induced PD mouse model by modulating DRP1 acetylation. A) Experimental timeline for the administration of HKL and MPTP to establish a PD mouse model and subsequent behavioral testing. B–F) Western blotting analysis of DRP1K711, DRP1, TH, and SIRT3 levels in SNc brain tissue samples of MPTP‐induced PD model mice treated with the SIRT3 agonist, HKL. Data are represented as the mean ± SD (n = 6). *P < 0.05, **P < 0.01, and ****P < 0.0001 versus indicated group. G–I) Immunofluorescence staining and analysis of TH and SIRT3 expression levels in the SNc region of HKL‐treated MPTP‐induced C57BL/6J PD model mice. Data are represented as the mean ± SD (n = 3). ****P < 0.0001 versus indicated group. J) Rotarod test analysis of motor function in MPTP‐induced PD mice treated with HKL. Data are represented as the mean ± SD (n = 8). *P < 0.05 and ***P < 0.001 versus indicated group. K) Test diagram from the Catwalk system. The system shows green paw prints and records parameters after recognition. L–N) Catwalk gait analysis of cadence, duration, and average speed in HKL‐treated MPTP‐induced PD mice. Data are represented as the mean ± SD (n = 8). *P < 0.05 and **P < 0.01 versus indicated group.
Figure 8
Figure 8
SIRT3 knockout exacerbates dopaminergic neuron loss and motor deficits in a PD mouse model. A) Generation of TH‐specific SIRT3‐knocked‐out mice via stereotaxic injection of pAAV‐TH‐Cre‐WPRE‐hGHpA virus into the SNc of SIRT3flox/flox mice. MPTP was administered to establish a PD mouse model, which was subjected to behavioral testing. B–D) Western blotting analysis of DRP1 and total acetylation levels in the SNc brain tissues of MPTP‐induced SIRT3‐knocked‐out PD mice. Data are represented as the mean ± SD (n = 6). **P < 0.01, ***P < 0.001 and ****P < 0.0001 versus indicated group. E–G) Western blotting analysis of SIRT3 and DRP1K711 levels in the SNc brain tissues of MPTP‐induced PD mice with SIRT3 CKO. Data are represented as the mean ± SD (n = 6). ***P < 0.001 and ****P < 0.0001 versus indicated group. H,I) Immunofluorescence analysis of TH and SIRT3 expression levels in the SNc region of MPTP‐induced PD mice with SIRT3 CKO. Data are represented as the mean ± SD (n = 3). *P < 0.05, **P < 0.01, and ***P < 0.001 versus indicated group. J) Rotarod test analysis of motor function in MPTP‐induced PD mice with SIRT3 CKO. Data are represented as the mean ± SD (n = 5). *P < 0.05, **P < 0.01, and ****P < 0.0001 versus indicated group. K) Test diagram from the Catwalk system. The system shows green paw prints and records parameters after recognition. L–N) Catwalk gait analysis of cadence, duration, and average speed in MPTP‐induced PD mice with SIRT3 CKO. Data are represented as the mean ± SD (n = 5). *P < 0.05, ***P < 0.001, and ****P < 0.0001 versus indicated group. Statistical analysis results are presented in Table S1 (Supporting Information).
Figure 9
Figure 9
Schematic illustration of SIRT3‐mediated DRP1 acetylation is a cause of mitochondrial dysfunction and subsequent damage to dopaminergic neurons in Parkinson's disease.

References

    1. Ascherio A., Schwarzschild M. A., Lancet Neurol. 2016, 15, 1257. - PubMed
    1. Giannoccaro M. P., La Morgia C., Rizzo G., Carelli V., Mov. Disord. 2017, 32, 346. - PubMed
    1. Subramaniam S. R., Chesselet M. F., Prog. Neurobiol. 2013, 106–107, 17. - PMC - PubMed
    1. Exner N., Lutz A. K., Haass C., Winklhofer K. F., EMBO J. 2012, 31, 3038. - PMC - PubMed
    1. Poewe W., Seppi K., Tanner C. M., Halliday G. M., Brundin P., Volkmann J., Schrag A. E., Lang A. E., Nat. Rev. Dis. Primers 2017, 3, 17013. - PubMed

LinkOut - more resources