. 2025 Mar-Apr;75(2):111-140.
doi: 10.3322/caac.21874. Epub 2025 Feb 20.

Cancer statistics for African American and Black people, 2025

Affiliations

Cancer statistics for African American and Black people, 2025

Anatu H Saka et al. CA Cancer J Clin. 2025 Mar-Apr.

Abstract

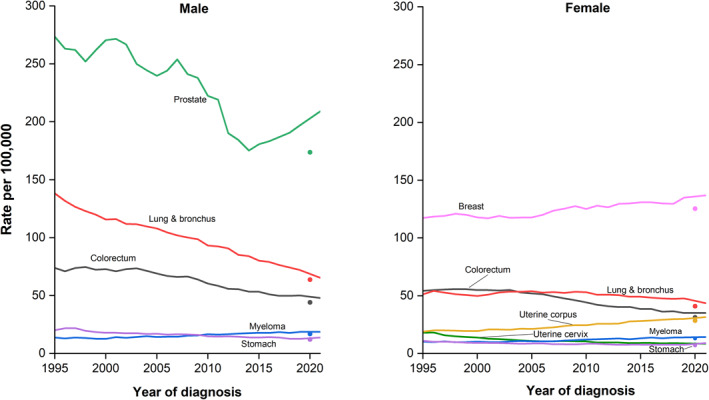
African American and other Black individuals (referred to as Black people in this article) have a disproportionate cancer burden, including the lowest survival of any racial or ethnic group for most cancers. Every 3 years, the American Cancer Society estimates the number of new cancer cases and deaths for Black people in the United States and compiles the most recent data on cancer incidence (herein through 2021), mortality (through 2022), survival, screening, and risk factors using population-based data from the National Cancer Institute and the Centers for Disease Control and Prevention. In 2025, there will be approximately 248,470 new cancer cases and 73,240 cancer deaths among Black people in the United States. Black men have experienced the largest relative decline in cancer mortality from 1991 to 2022 overall (49%) and in almost every 10-year age group, by as much as 65%-67% in the group aged 40-59 years. This progress largely reflects historical reductions in smoking initiation among Black teens, advances in treatment, and earlier detections for some cancers. Nevertheless, during the most recent 5 years, Black men had 16% higher mortality than White men despite just 4% higher incidence, and Black women had 10% higher mortality than White women despite 9% lower incidence. Larger inequalities for mortality than for incidence reflect two-fold higher death rates for prostate, uterine corpus, and stomach cancers and for myeloma, and 40%-50% higher rates for colorectal, breast, cervical, and liver cancers. The causes of ongoing disparities are multifactorial, but largely stem from inequalities in the social determinants of health that trace back to structural racism. Increasing diversity in clinical trials, enhancing provider education, and implementing financial incentives to ensure equitable care across the cancer care continuum would help close these gaps.

Keywords: African Americans; Black people; cancer statistics; incidence; mortality.


Conflict of interest statement

Anatu H. Saka, Angela N. Giaquinto, Jessica Star, Ahmedin Jemal, and Rebecca L. Siegel are employed by the American Cancer Society, which receives grants from private and corporate foundations, including foundations associated with companies in the health sector, for research outside of the submitted work. The authors are not funded by or key personnel for any of these grants, and their salary is solely funded through American Cancer Society funds. The remaining authors disclosed no conflicts of interest.

Figures

FIGURE 1
FIGURE 1
Leading sites of new cancer cases and deaths among Black People in United States, 2025 estimates. Ranking is based on modeled projections and may differ from the most recent observed data. Estimates are rounded to the nearest 10 and exclude basal and squamous cell skin cancers and in situ carcinoma, with the exception of urinary bladder.
FIGURE 2
FIGURE 2
Trends in cancer incidence (1995–2021) and death rates (1990–2022) among Black people by sex, United States. Rates are age adjusted to the 2000 US standard population, and incidence rates (excluding 1995–1997) are also adjusted for reporting delay. Incidence data for 2020 are shown separate from trend lines.
FIGURE 3
FIGURE 3
Trends in cancer death rates and mortality rate ratios among Black and White people by site and sex, United States, 1990–2022. Race is exclusive of Hispanic ethnicity. Rates are age adjusted to the 2000 US standard population. Vertical scales (death rates and rate ratios) differ by site. MRR indicates mortality rate ratio.
FIGURE 4
FIGURE 4
Relative decline in cancer death rates from 1991 to 2022 by age, race, and sex. Race is exclusive of Hispanic ethnicity. Rates are age adjusted to the 2000 US standard population. Louisiana, Oklahoma, and New Hampshire were excluded from the year 1991 because of death misclassification for those states.
FIGURE 5
FIGURE 5
Five‐year relative survival rates by race, stage at diagnosis, and cancer type, United States, 2014–2020. Race is exclusive of Hispanic ethnicity. All patients were followed through 2021. Colorectum excludes appendiceal cancers. The standard error of the survival rate is between 5 and 10 percentage points.
FIGURE 6
FIGURE 6
Trends in the leading cause of cancer death among Black men and women, United States, 1969–2022. Race includes Hispanic ethnicity. Rates are age adjusted to the 2000 US standard population.
FIGURE 7
FIGURE 7
Trends in adult obesity prevalence, adults aged 20−74 years, by sex and race/ethnicity, United States, from 1976 to March 2020. Race is exclusive of Hispanic ethnicity. Obesity is defined as a body mass index ≥30.0 kg/m2. Estimates are age adjusted to the 2000 US standard population.
FIGURE 8
FIGURE 8
Adult current smoking cigarette prevalence (%) by race and sex, United States, 1965–2023. Race includes Hispanic ethnicity. Ever smoked 100 cigarettes in lifetime and smoking every day or some days at time of survey. Estimates are age adjusted to the year 2000 US census population standard using five age groups: 18–24, 25–34, 35–44, and 45–64 years and 65 years and older. Because of changes in National Health Interview Survey design, 2019 estimates are not directly comparable to prior years and are separated from the trend line.
FIGURE 9
FIGURE 9
Trends in incidence rates among Black people for selected cancers by sex, 1995–2021. Race excludes Hispanic ethnicity. Rates (excluding 1995–1997) are delay adjusted and age adjusted to the 2000 US standard population. Incidence data for 2020 are shown separate from trend lines.
FIGURE 10
FIGURE 10
Trends in lung cancer incidence rates by race, sex, and age, United States, 1998–2021. Race is exclusive of Hispanic ethnicity. Rates are adjusted for delays in reporting and age adjusted to the 2000 US standard population. Incidence data for 2020 are shown separate from trend lines.

References

    1. U.S. Census Bureau . Table DP05. American Community Survey (ACS) Demographic and Housing Estimates. ACS 1‐Year Estimates Data Profiles. U.S. Census Bureau; 2022.
    1. Mahal BA, Alshalalfa M, Kensler KH, et al. Racial differences in genomic profiling of prostate cancer. N Engl J Med. 2020;383(11):1083‐1085. doi:10.1056/nejmc2000069 - DOI - PMC - PubMed
    1. Brawley OW. Prostate cancer and the social construct of race. Cancer. 2021;127(9):1374‐1376. doi:10.1002/cncr.33417 - DOI - PubMed
    1. Siegel RL, Kratzer TB, Giaquinto AN, Sung H, Ahmedin J. Cancer statistics, 2025. CA Cancer J Clin. 2025. doi:10.3322/caac.21871 - DOI - PMC - PubMed
    1. Williams DR, Lawrence JA, Davis BA. Racism and health: evidence and needed research. Annu Rev Public Health. 2019;40(1):105‐125. doi:10.1146/annurev-publhealth-040218-043750 - DOI - PMC - PubMed