. 2025 Feb;14(2):e70042.
doi: 10.1002/jev2.70042.

Extracellular Histones as Exosome Membrane Proteins Regulated by Cell Stress

Affiliations

Extracellular Histones as Exosome Membrane Proteins Regulated by Cell Stress

Birendra Singh et al. J Extracell Vesicles. 2025 Feb.

Abstract

Histones are conserved nuclear proteins that function as part of the nucleosome in the regulation of chromatin structure and gene expression. Interestingly, extracellular histones populate biofluids from healthy individuals, and when elevated, may contribute to various acute and chronic diseases. It is generally assumed that most extracellular histones exist as nucleosomes, as components of extracellular chromatin. We analysed cell culture models under normal and stressed conditions to identify pathways of histone secretion. We report that core and linker histones localize to extracellular vesicles (EVs) and are secreted via the multivesicular body/exosome pathway. Upregulation of EV histone secretion occurs in response to cellular stress, with enhanced vesicle secretion and a shift towards a population of smaller EVs. Most histones were membrane associated with the outer surface of EVs. Degradation of EV-DNA did not impact significantly on EV-histone association. Individual histones and histone octamers bound strongly to liposomes and EVs, but nucleosomes did not, showing histones do not require DNA for EV binding. Histones colocalized to tetraspanin positive EVs but using genetic or pharmacological intervention, we found that all known pathways of exosome biogenesis acted positively on histone secretion. Inhibition of autophagy and lysosomal degradation had a strong positive effect on EV histone release. Unexpectedly, EV-associated histones lacked the extensive post-translational modification of their nuclear counterparts, suggesting loss of PTMs may be involved in their trafficking or secretion. Our data does not support a significant role for EV-histones existing as nucleosomes. We show for the first time that histones are secreted from cells as membrane proteins via EVs/exosomes. This fundamental discovery provides support for further investigation of the biological activity of exosome associated histones and their role in disease.

Keywords: cellular stress; exosome; extracellular vesicles; histone; membrane associated proteins; posttranslational modification.


Conflict of interest statement

Samir El Andaloussi is a founder and consultant for Evox Therapeutics. Samir El Andaloussi, Joel Z. Nordin, and Oscar P. B. Wiklander are shareholders in Evox Therapeutics. The remaining authors declare no competing interests. The other authors declare no conflicts of interest.

Figures

FIGURE 1
FIGURE 1
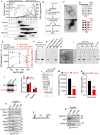
Histones are associated with ILVs and EVs. (A) WB of whole cell lysate (WCL, 10 µg) from a stable OLN‐93 cell line expressing human CD63‐EGFP and EVs (10, 20 µg) from a 100,000 ×g pellet. CD9, CD63, Tsg101, core histones (H2A, H2B, H3 and H4), the Golgi marker GM130, as well as Actb were identified using specific antibodies. The approximate molecular mass is shown in kDa. (B) Immuno‐TEM micrographs of OLN‐93 EV100,000 ×g using anti‐CD63 primary antibody and secondary antibody conjugated to with 10 nm gold. (C) Confocal micrographs from a single z‐plane of OLN‐93 cells showing colocalization of anti‐H3 (red) with anti‐CD63 (green). Nuclei were counterstained with DAPI (blue). Inset shows a cropped and expanded region of the main image. (D) Confocal micrograph showing Duolink staining (red) due to colocalization of anti‐H3 (rabbit) and anti‐CD63 (mouse) antibodies. (E) WB showing localization of a range of membrane, EV and organelle markers together with linker and core histones in OptiPrep purified EV100,000 × g (300 µg) fractions from a 12% to 36% (w/v) equilibrium density gradient. One‐twentieth of each fraction was loaded on the gel. Experiments were repeated 3 times, and one representative image is shown. (F) Representative immuno‐TEM micrograph of OLN‐93 cell sections showing anti‐CD63. Inset panel shows a magnified region containing an MVB. The column chart on the right shows quantification of the total number of MVBs versus CD63+ MVBs (black), and the total number of ILVs versus CD63+ ILVs (red) as a % of total. (G) as for (F), but showing anti‐H1. The column chart on the right shows the total number and H1‐positive ILVs per MVB. Error bars represent the mean ± SD. (H) Immuno‐TEM showing differential labelling of anti‐CD63 (5 nm gold, open arrowheads) and anti‐H1 (10 nm gold, solid arrowheads). Panels below (1 and 2) show higher magnification images of the regions indicated in (H). Solid arrowheads indicate anti‐H1 labelling and open arrowheads indicate anti‐CD63 labelling. (I) Scatter plot showing quantification of CD63 and H1 labelling and colocalization (on the same ILV). A total of 10 images from separate cells and sections were quantified, and the numbers of ILVs per MVB are represented by each point. Error bars represent the mean ± SD. (J) Immuno‐TEM micrographs of OLN‐93 EVOptiPrep showing anti‐CD63 (10 nm gold, solid arrowheads) and anti‐H1 (5 nm gold, open arrowheads). Note gold particle sizes are opposite to those used in (F).
FIGURE 2
FIGURE 2
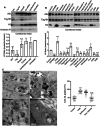
Cellular stress enhances the release of histones via ILVs/EVs. (A) Schematic diagram outlining the experimental procedure for the heat stress experiment, showing sample collection times for Before, Heat stress and After conditions. (B) WB showing markers (specific antibodies as shown) detected after pulldown with StrataClean resin of total protein from 1 mL of conditioned media from Before, Heat stress and After samples, as well as fresh, unconditioned media (mock). (C) WB of EV100,000 × g (11 µg per lane) isolated from the same conditioned media samples shown in (B). (D)–(E) OLN‐93 cells were stressed by heat, LPS, hypoxia, and H2O2, followed by WB to quantify histone H2B and H3 in the cytoplasm and EV100,000 × g . Column charts show the ratio between band intensities for stress versus control conditions. Three independent experiments were performed, and one representative WB image is shown. (F) Immuno‐TEM images of control and stressed OLN‐93 cell sections showing ILVs within an MVB. Anti‐CD63 (5 nm gold; open arrowheads) and anti‐H1 (10 nm gold; closed arrowheads). (G) Quantification of the number of H1‐positive ILVs per MVB present under the various conditions. (H) Co‐localisation of anti‐CD63/H1 on the same ILV under control and stress conditions. Error bars represent the SD. One‐way ANOVA was used to compare control and stress conditions. * p ≤ 0.05, *** p ≤ 0.001. (I) Representative TEM micrographs of negatively stained OLN‐93 EVOptiPrep isolated from control and stress conditions as indicated in each panel. (J) Scatter plots showing size distribution of EVs (n = 500 EVs measured from n = 10 randomly selected images) measured in TEM micrographs from each condition. Statistical significance between control and stress conditions (***, p ≤ 0.001) using one‐way ANOVA followed by Bonferroni's multiple comparison post‐test. Horizontal bars in each plot represent the mean diameter in nm, shown below with the ±SD, as well as the mode size (in 10 nm bins).
FIGURE 3
FIGURE 3
Histones associate with the EV membrane. (A) Line graphs (above) showing quantification of protein (dashed lines) and DNA (solid lines) by Qubit in OptiPrep fractions from different stress conditions. WBs (below) showing distribution of H3 in OptiPrep fractions. (B) Schematic diagram showing the basic procedure used to extract histones from EVOptiPrep. (C) TEM images showing control (Ctrl) EVs or following 750 mM NaCl treatment. (D) Extraction of histones from OptiPrep purified (fractions 4–7; EVOptiPrep). Approximately 10 µg EVs were treated with 150–750 mM NaCl for 24 h at 4°C, followed by ultracentrifugation and estimation of H3 in the supernatants and pellets by dot blot. (E) Line graphs showing the intensities of dot blots (H3 quantification, black) and DNA content (Qubit assay). Statistical analysis between 150 mM NaCl as a control and other NaCl concentrations by one‐way ANOVA. * p ≤ 0.05, ** p ≤ 0.01. (F) Extraction of histones in the supernatant (S) and remaining in the pellet (P) from EVOptiPrep treated with 750 mM NaCl and shown by WB. (G) S and P fractions of EVOptiPrep after extraction with 750 mM NaCl, then sonication and re‐pelleting, followed by a further round of extraction with 750 mM NaCl to dissociate luminal contents. The remaining pellet shows residual H3 that was not extracted by 750 mM NaCl. (H) TEM images showing intact EV membranes after 25 mM lithium 3,5‐diiodosalicylate treatment. (I) Extraction of histones into the supernatant (S) or remaining in the pellet of EVOptiPrep following treatment with increasing concentrations of lithium 3,5‐diiodosalicylate (10‐50 mM) or Triton X‐100 (0.1% TX‐100). (J) WB showing H3 present in EVOptiPrep (control or sonicated) with and without nuclease digestion (DNAseI, S1 nuclease and Exonuclease III). (K) Column chart showing DNA quantification (Qubit) in the same samples as (J). (L) TapeStation gel image of total EV DNA purified from control and digested samples. (M) Column chart showing quantification of DNA by TapeStation and, (N) Quantification of DNA in same samples using Qubit. (O) Analysis of OLN‐93 EVOptiPrep by WB without (Ctrl) or following trypsin treatment (1:1500‐1:150 µg trypsin:µg EV protein). The presence of truncated bands for histone proteins following trypsin treatment is indicated on the right by open arrowheads. (P) Schematic diagram of an epitope tagged H3 cassette used to express the protein in a HEK293 stable cell line. HA‐tag is located at the N‐terminus and a 6xHis‐tag at the C‐terminus (not to scale). (Q) WB analysis of EV100,000 × g isolated from stable HA‐H3‐6xHis HEK293 cell line after trypsin treatment. Location of full‐length HA‐H3‐6xHis, as well as partially degraded species, is indicated by black or open arrowheads, respectively. Control recombinant histone digestion by trypsin is shown in Figure S12.
FIGURE 4
FIGURE 4
Preferential membrane binding of histones and octamers versus nucleosomes. (A) Analysis of histone interaction with liposomes. Total histones or individual recombinant histones (as indicated) were mixed with liposomes derived from OLN‐93 total cellular lipids and washed extensively in a 100,000 MWCO spin concentrator. The retentate was subjected to WB with specific anti‐histone antibodies. A histone protein‐only control (without liposomes) was used to control for lipid‐independent retention of histones by the MWCO filter. Histone proteins (200 ng as indicated) were loaded as references. (B) Liposome flotation on a sucrose density gradient (0%–40%). Histones, as shown in (A), were mixed with liposomes and then added to the bottom layer (40% sucrose) of the gradient and subjected to ultracentrifugation at 100,000 × g. Fractions were collected and analysed by WB. (C) Recombinant histone octamer proteins (5 µg) were mixed with liposomes (20 µg) and separated as shown in (B). Octamers were detected by WB using an anti‐His tag antibody. (D) As for (C), but using recombinant nucleosomes instead of octamers. (E) Dot blot showing binding of octamers or nucleosomes to EVOptiPrep. Serially diluted EVs were blotted onto a nitrocellulose membrane and probed with 1 µg/mL octamers/nucleosomes. The bound fractions were detected using an anti‐His tag antibody. (F) Line graphs showing the intensity of dot blots plotted from (E). Two‐way ANOVA and Bonferroni multiple comparison test was performed: ** p ≤ 0.01, *** p ≤ 0.001.
FIGURE 5
FIGURE 5
Histone secretion is influenced by multiple cellular pathways. (A) WBs showing the effects of siRNA mediated knock‐down of Alix, Tsg101, and Smpd2 in OLN‐93 cells. H3 and EV markers (Alix, Tsg101, as well as the plasma membrane/microvesicle marker Annexin A1) were quantified in total protein recovered from the media by StrataClean pulldown. The experiment was repeated 4 times, and a representative blot is shown. Band intensities were quantified, and the column chart below shows the ratio of H3 (treated/control) from four independent experiments. (B) Pharmacological treatment of OLN‐93 cells, analysed as in (A). Control is without treatment. GW4869 reduced EV production by the cells. To compensate and visualise Alix and Tsg101 signals in blots, 2.5 times more samples were loaded in GW4869 treated samples in comparison to control and other samples. (C) Immuno‐TEM micrographs showing anti‐H1 labelling associated with ILVs in OLN‐93 cell sections, following treatment with compounds that significantly increased (3‐MA or bafilomycin) or decreased (sodium butyrate) H3 secretion into the media. Right, scatter plot showing quantification of histone positive ILVs under control and following treatment. One‐way ANOVA: * p ≤ 0.05, ** p ≤ 0.01, *** p ≤ 0.001.
FIGURE 6
FIGURE 6
Histones are surface‐associated in intact EVs and carry fewer PTMs than their nuclear counterparts. (A) Plots showing representative IFCM data obtained from HeLa cell conditioned media (CM) and media controls stained with either AF488 labelled anti‐H3 or FITC labelled anti‐H4 antibodies, or a mixture of APC labelled anti‐CD9/CD63/CD81 antibodies to detect total tetraspanin positive EVs. (B) Quantification of detected gateable events positive for single stained H3, H4, or tetraspanins (n = 3) in CM samples collected at different time points from both control and H2O2 treated cell cultures. Samples were diluted post staining as indicated on the y‐axes. (C) H3 co‐labelling and (D) H4 co‐labelling with anti‐CD9, ‐CD63, or ‐CD81 antibodies in CM from 24 h H2O2 treated samples. See also Figure S15. Statistical comparisons by two‐way ANOVA. ** p ≤ 0.005, *** p ≤ 0.001, **** p ≤ 0.0001. (E) Radial plot showing relative abundance of H3 post‐translational modifications (PTMs) identified in EVOptiPrep versus nuclear histones. K = lysine, ac = acetylation, me = mono‐ (me1), di‐ (me2) or tri‐ (me3) methylation, ph = phosphorylation. (F) Representative examples of H3 PTMs that were selectively enriched in the nucleus, or in EVs. Lysine (K) trimethylation (me3) results from the covalent attachment of three me groups to a K residue and is therefore a relatively “slow” modification. H3 is poorly modified with me3 in EVs relative to nuclei regardless of whether this PTM benchmarks actively transcribed chromatin (H3K4me3) or silenced heterochromatin (H3K9me3). H3K9 is relatively unmodified in EVs, and H3K79me2 is an example of a modification that is enriched in EV histones. Phosphorylation of H3S10 is selectively enriched in EVs from LPS treated cells.
FIGURE 7
FIGURE 7
Potential pathways for histone secretion via exosomes. Schematic diagram summarizing the findings of this paper. (A) Extracellular histones (dark red ovals) internalized by endocytosis would undergo inward budding into MVBs and associate with the outer surface of ILVs. Cytoplasmic histones (green ovals) sorted during (B) ESCRT‐dependent or (C) ESCRT‐independent (ceramide pathway) ILV formation may localize as internal/luminal cargo (blue ovals). (D) Histones originating from the nucleus (green diamonds) and captured by autophagosomes may partition to ILVs after amphisomes or lysosomes fuse with MVBs. (E) Posttranslational modification of histones in subcellular compartments such as the cytoplasm may also be important for sorting to MVBs/ILVs. (F) The possible route whereby histones may traffic from the nucleus to amphisomes is unknown.

References

    1. Abrams, S. T. , Zhang N., Manson J., et al. 2013. “Circulating Histones are Mediators of Trauma‐Associated Lung Injury.” American Journal of Respiratory and Critical Care Medicine 187, no. 2: 160–169. - PMC - PubMed
    1. Al‐Ani, A. , Toms D., Kondro D., Thundathil J., Yu Y., and Ungrin M.. 2018. “Oxygenation in Cell Culture: Critical Parameters for Reproducibility are Routinely Not Reported.” PLoS ONE 13, no. 10: e0204269. - PMC - PubMed
    1. Allfrey, V. G. , Faulkner R., and Mirsky A. E.. 1964. “Acetylation and Methylation of Histones and Their Possible Role in the Regulation of RNA Synthesis.” Proceedings of the National Academy of Sciences of the United States of America 51, no. 5: 786–794. - PMC - PubMed
    1. Anand, P. , Cermelli S., Li Z., et al. 2012. “A Novel Role for Lipid Droplets in the Organismal Antibacterial Response.” eLife 1: e00003. - PMC - PubMed
    1. Balaj, L. , Lessard R., Dai L., et al. 2011. “Tumour Microvesicles Contain Retrotransposon Elements and Amplified Oncogene Sequences.” Nature Communications 2: 180. - PMC - PubMed

LinkOut - more resources