. 2025 Feb;28(2):e70085.
doi: 10.1111/ele.70085.

A Mechanistic Approach to Animal Dispersal-Quantifying Energetics and Maximum Distances

Affiliations

A Mechanistic Approach to Animal Dispersal-Quantifying Energetics and Maximum Distances

Caitlin Wilkinson et al. Ecol Lett. 2025 Feb.

Abstract

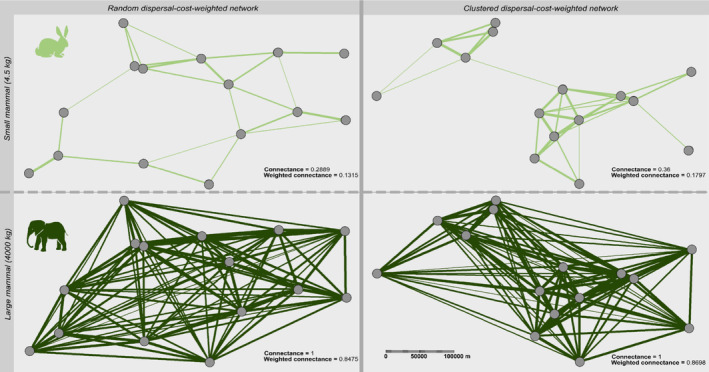
Dispersal is a fundamental process driving many ecological patterns. During transfer, species often make large-scale displacements resulting in significant energy losses with implications for fitness and survival, however generalising these losses across different taxonomic groups is challenging. We developed a bioenergetic dispersal model based on fundamental processes derived from species traits. By balancing energy storage and energy loss during active dispersal, our mechanistic model can quantify energy expenditures depending on landscape configuration and the species in focus. Moreover, it can be used to predict the maximum dispersal capacity of animals, which we compare with recorded maximum dispersal distances (n = 1571). Due to its foundation in bioenergetics it can easily be integrated into various ecological models, such as food-web and meta-community models. Furthermore, as dispersal is integral to ecological research, the quantification of dispersal capacities provides valuable insight into landscape connectivity, species persistence, and distribution patterns with implications for conservation research.

Keywords: bird; body size; fish; locomotion mode; mammal; traits; transfer.


Figures

FIGURE 1
FIGURE 1
Conceptual illustration of the bioenergetic dispersal model for flying, running and swimming animals during the transfer phase of active dispersal. The model incorporates energy storage (i.e., the fat reserves an animal has) represented by E0 and energy costs. The energetic costs during dispersal are a combination of an animals' maintenance costs (i.e., basal metabolic rate, BMR) and the locomotion costs per unit time (LCOT) as a function of travel speed v.
FIGURE 2
FIGURE 2
Allometric relationships of the processes underlying the bioenergetic dispersal model: (a) energy storage E0; (b) basal metabolic rate BMR; (c) locomotion costs (per time) LCOT; (d) travel speed v. The colours represent either taxonomic group (bird, mammal, fish) or locomotion mode (flying, running, swimming).
FIGURE 3
FIGURE 3
Examples of how to quantify the energetics of animal dispersal. (a) The relationship between absolute energy depletion (i.e., the decay in energy remaining) [J] with dispersal distance [m] for a 2 kg animal across locomotion modes and corresponding taxonomic groups. (b) The relationship between relative energy depletion (i.e., the energetic costs of dispersing relative to the available energy) and distance for differently sized running animals (here depicted for running animals). The steeper slope for the small animal (light green) indicates a lower energetic efficiency compared to the large animal (dark green). The dashed line is a visual representation of lambda λ (here: 0.1), the proportion of energy needed upon arrival for an animal to survive and fulfil its daily tasks. Here, the intersection of both lines with the dashed line shows the maximum dispersal distance of each species respectively. (c) The relationship between absolute cost of dispersal per distance [J/m] with body mass [kg] across locomotion modes and corresponding taxonomic groups.
FIGURE 4
FIGURE 4
Dispersal‐cost‐weighted spatial networks for differently sized running mammals (4.5 and 4000 kg) across two landscape types (random and clustered). The line thickness indicates the relative energy remaining when travelling from one patch to another, which can be used as an indicator for dispersal flux. For each species and landscape type, the connectance (i.e., based on presence‐absence of dispersal links) and weighted connectance (i.e., based on energetic‐cost‐weighted dispersal links) are shown.
FIGURE 5
FIGURE 5
The relationship between maximum dispersal distance and body mass: (a) flying birds, (b) running mammals and (c) swimming fishes. The solid lines represent the absolute maximum dispersal distances predicted using the bioenergetic model for each locomotion mode and related taxonomic group. The dashed line and confidence bands represent the generalised additive model (GAM) output of the empirical data for flying birds (n = 744), running mammals (n = 648) and swimming fishes (n = 179). Note that the GAM is meant as a visual guidance for qualitative comparisons with the model prediction.

References

    1. Alerstam, T. , and Lindström Å.. 1990. “Optimal Bird Migration: The Relative Importance of Time, Energy, and Safety.” In Bird Migration, edited by Gwinner E., 331–351. Springer.
    1. Antoł, A. , and Kozłowski J.. 2020. “Scaling of Organ Masses in Mammals and Birds: Phylogenetic Signal and Implications for Metabolic Rate Scaling.” Zookeys 982: 149–159. - PMC - PubMed
    1. Beamish, F. W. H. 1978. “2 ‐ Swimming Capacity.” In Fish Physiology, Locomotion, edited by Hoar W. S. and Randall D. J., 101–187. Academic Press.
    1. Benoit, L. , Hewison A. J. M., Coulon A., et al. 2020. “Accelerating Across the Landscape: The Energetic Costs of Natal Dispersal in a Large Herbivore.” Journal of Animal Ecology 89: 173–185. - PubMed
    1. Berti, E. , Davoli M., Buitenwerf R., et al. 2022. “The r Package Enerscape: A General Energy Landscape Framework for Terrestrial Movement Ecology.” Methods in Ecology and Evolution 13: 60–67.