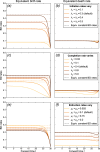
Speciation completion rates have limited impact on macroevolutionary diversification
- PMID: 39976411
- PMCID: PMC11867190
- DOI: 10.1098/rstb.2023.0317
Speciation completion rates have limited impact on macroevolutionary diversification
Abstract
Standard birth-death (BD) processes used in macroevolutionary studies assume instantaneous speciation, an unrealistic premise that limits the interpretation of speciation and extinction rates. The protracted birth-death (PBD) model instead assumes that speciation involves two steps: initiation and completion. In order to understand their respective influence on macroevolutionary speciation rates, we compute a standard time-varying BD scenario that is 'equivalent' to the PBD model in terms of speciation and extinction probabilities. First, we find a sharp decline in the equivalent birth rate near the present, indicating that rates estimated at the tips of phylogenies may not accurately reflect the underlying speciation process. Second, the completion rate controls the timing of the decay rather than the asymptotic equivalent rates. The equivalent birth rate in the past scales with the speciation initiation rate, with a scaling factor depending mostly on the population extinction rate. Our results suggest that the rates of population formation and extinction may often play a larger role than the speed of accumulation of reproductive isolation in modulating speciation rates. Our study establishes a theoretical framework for understanding how microevolutionary processes combine to explain the diversification of species on macroevolutionary time scales.This article is part of the theme issue '"A mathematical theory of evolution": phylogenetic models dating back 100 years'.
Keywords: macroevolution; microevolution; phylogeny; speciation.
Conflict of interest statement
We declare we have no competing interests.
Figures


Similar articles
-
Microevolutionary processes impact macroevolutionary patterns.BMC Evol Biol. 2018 Aug 10;18(1):123. doi: 10.1186/s12862-018-1236-8. BMC Evol Biol. 2018. PMID: 30097006 Free PMC article.
-
Fossils improve extinction-rate estimates under state-dependent diversification models.Philos Trans R Soc Lond B Biol Sci. 2025 Feb 13;380(1919):20230313. doi: 10.1098/rstb.2023.0313. Epub 2025 Feb 20. Philos Trans R Soc Lond B Biol Sci. 2025. PMID: 39976401 Free PMC article.
-
Estimating the duration of speciation from phylogenies.Evolution. 2014 Aug;68(8):2430-40. doi: 10.1111/evo.12433. Epub 2014 Jun 3. Evolution. 2014. PMID: 24758256 Free PMC article.
-
Reading tree leaves: inferring speciation anfd extinction processes using phylogenies.Philos Trans R Soc Lond B Biol Sci. 2025 Feb 13;380(1919):20230309. doi: 10.1098/rstb.2023.0309. Epub 2025 Feb 20. Philos Trans R Soc Lond B Biol Sci. 2025. PMID: 39976406 Free PMC article. Review.
-
Opening the species box: what parsimonious microscopic models of speciation have to say about macroevolution.J Evol Biol. 2024 Dec 2;37(12):1433-1457. doi: 10.1093/jeb/voae134. J Evol Biol. 2024. PMID: 39468751 Review.
Cited by
-
"A mathematical theory of evolution": phylogenetic models dating back 100 years.Philos Trans R Soc Lond B Biol Sci. 2025 Feb 13;380(1919):20230297. doi: 10.1098/rstb.2023.0297. Epub 2025 Feb 20. Philos Trans R Soc Lond B Biol Sci. 2025. PMID: 39976405 Free PMC article. No abstract available.
-
Negative global-scale association between genetic diversity and speciation rates in mammals.Nat Commun. 2025 Feb 20;16(1):1796. doi: 10.1038/s41467-025-56820-y. Nat Commun. 2025. PMID: 39979262 Free PMC article.
References
-
- Morlon H, Andréoletti J, Barido-Sottani J, Lambert S, Perez-Lamarque B, Quintero I, Senderov V, Veron P. 2024. Phylogenetic Insights into Diversification. Annu. Rev. Ecol. Evol. Syst. 55, 1–21. (10.1146/annurev-ecolsys-102722-020508) - DOI
-
- Coyne JA, Orr HA. 2004. Speciation. Sunderland, MA: Sinauer Associates, Inc. Publ.
-
- Rosenblum EB, Sarver BAJ, Brown JW, Des Roches S, Hardwick KM, Hether TD, Eastman JM, Pennell MW, Harmon LJ. 2012. Goldilocks Meets Santa Rosalia: An Ephemeral Speciation Model Explains Patterns of Diversification Across Time Scales. Evol. Biol. 39, 255–261. (10.1007/s11692-012-9171-x) - DOI - PMC - PubMed
MeSH terms
LinkOut - more resources
Full Text Sources
Miscellaneous

