. 2025 Feb 13;380(1919):20230306.
doi: 10.1098/rstb.2023.0306. Epub 2025 Feb 20.

Multiple merger coalescent inference of effective population size

Affiliations

Multiple merger coalescent inference of effective population size

Julie Zhang et al. Philos Trans R Soc Lond B Biol Sci. .

Abstract

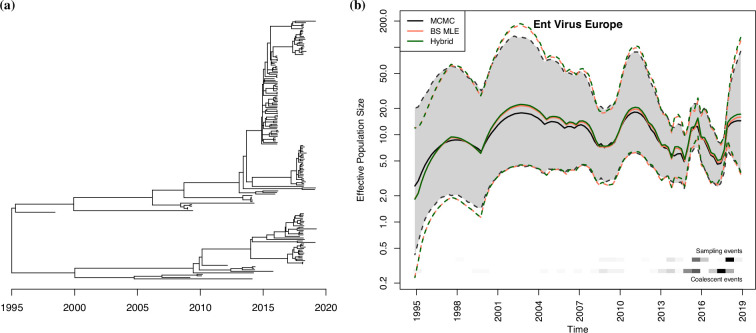
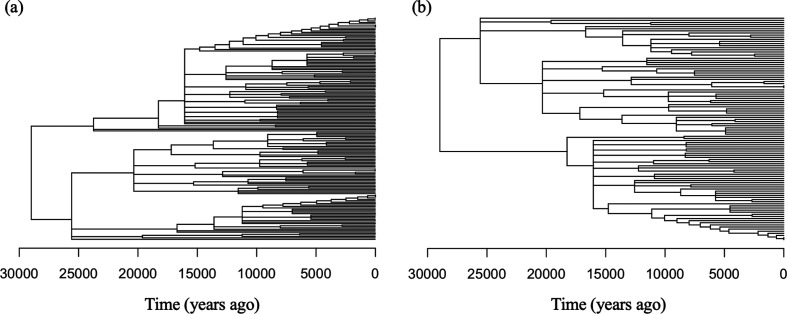
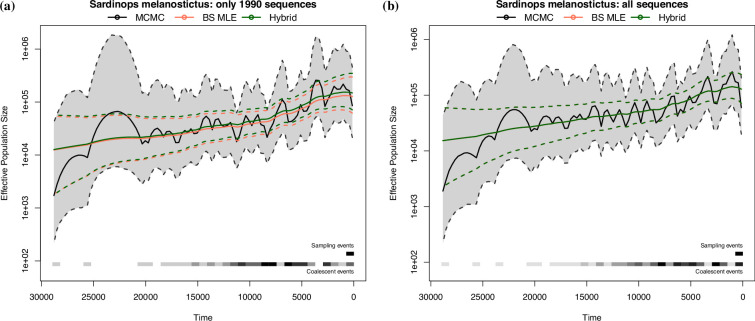
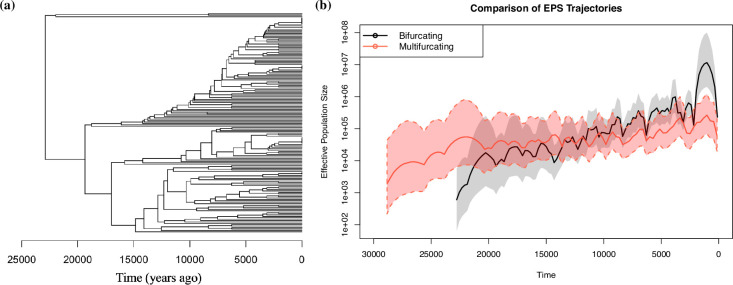
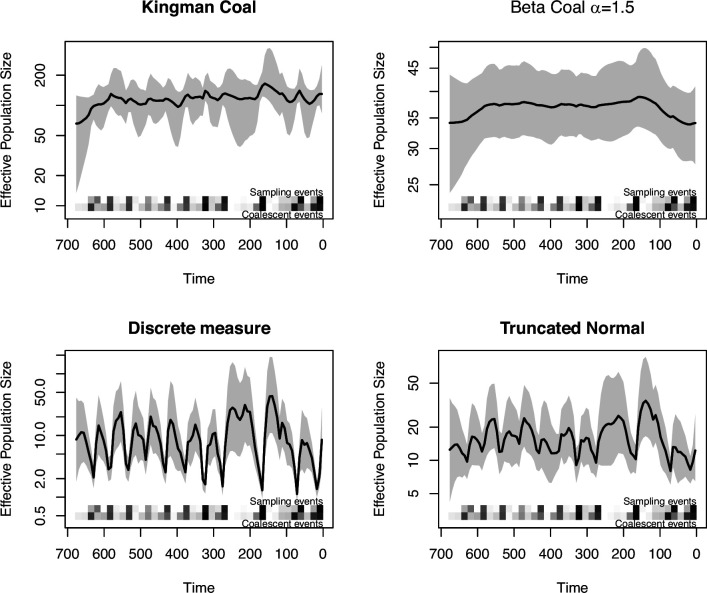
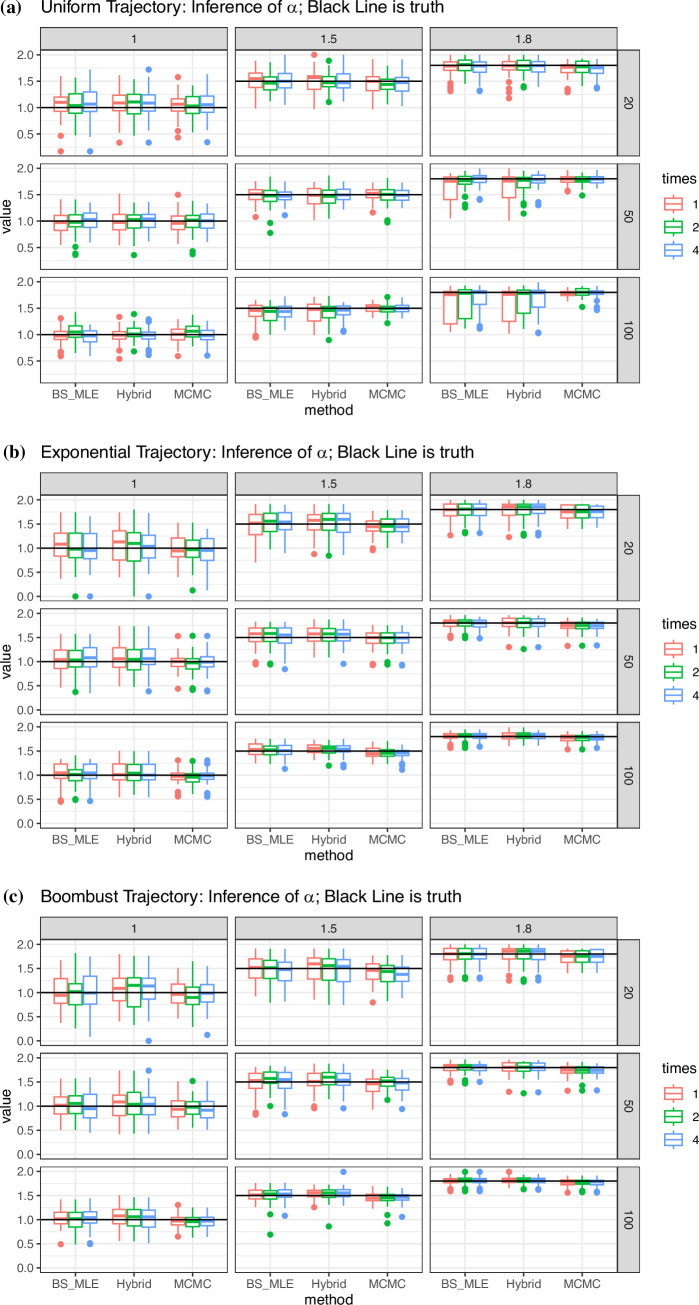
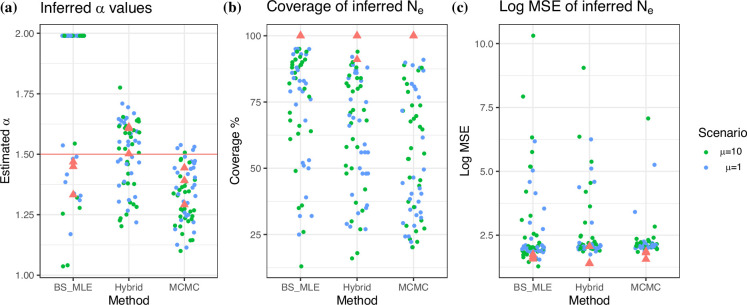
Variation in a sample of molecular sequence data informs about the past evolutionary history of the sample's population. Traditionally, Bayesian modelling coupled with the standard coalescent is used to infer the sample's bifurcating genealogy and demographic and evolutionary parameters such as effective population size and mutation rates. However, there are many situations where binary coalescent models do not accurately reflect the true underlying ancestral processes. Here, we propose a Bayesian non-parametric method for inferring effective population size trajectories from a multifurcating genealogy under the [Formula: see text]-coalescent. In particular, we jointly estimate the effective population size and the model parameter for the Beta-coalescent model, a special type of [Formula: see text]-coalescent. Finally, we test our methods on simulations and apply them to study various viral dynamics as well as Japanese sardine population size changes over time. The code and vignettes can be found in the phylodyn package.This article is part of the theme issue '"A mathematical theory of evolution": phylogenetic models dating back 100 years'.

Keywords: Beta-coalescent; Gaussian processes; Lambda-coalescent; Multiple mergers coalescent.


Conflict of interest statement

We declare we have no competing interests.

Figures

The effect of in tree topology and coalescent times.
Figure 1.
The effect of α in tree topology and coalescent times. (a) Average block size for different values of α and number of tips. (b) Total coalescent rates λb=k=2b(bk)λb,k when there are b lineages for different values of α, scaled by (b2), the rate under Kingman's coalescent.
A multifurcating tree with eight total lineages and six coalescent events labelled with the coalescent times.
Figure 2.
A multifurcating tree with eight total lineages and six coalescent events labelled with the coalescent times t, sampling times s, block sizes m and extant lineages A(t). Here, there are L=3 sampling times.
Comparison of different methods estimating exponential.
Figure 3.
Comparison of different methods estimating exponential Ne(t). (a) A simulated genealogy under the Beta-coalescent with α=1.5 and the exponential growth Ne(t) trajectory. The genealogy has 39 internal nodes and 50 tips. (b) The effective population size trajectories reconstructed by different methods. Note the y-axis is plotted in log-scale. Solid lines are the median trajectories, and dotted lines are the 95% credible bands. The true trajectory is plotted in purple, and the solid black line and shaded band are the median and 95% credible band of the inferred Ne(t) using the true α=1.5.
A dated genealogy generated using 266 RSV-A sequences from Nextstrain.
Figure 4.
(a) A dated genealogy generated using 266 RSV-A sequences from Nextstrain. (b) The reconstructed effective population size trajectories for RSV-A sequences in south and southeast Asia. Note the y-axis is plotted in log-scale. Solid lines are the median trajectory, and dotted lines are the 95% credible band.
A dated phylogeny generated using 171 Enterovirus D68 sequences from Nextstrain.
Figure 5.
(a) A dated phylogeny generated using 171 Enterovirus D68 sequences from Nextstrain. (b) The reconstructed effective population size trajectories for Enterovirus D68 sequences in Europe. Note the y-axis is plotted in log-scale. Solid lines are the median trajectory, and dotted lines are the 95% credible band.
A dated phylogeny generated using all Sardinops melanostictus sequences.
Figure 6.
(a) A dated phylogeny generated using all Sardinops melanostictus sequences. There are 156 tips and 95 internal nodes. (b) The subtree constructed of only sequences sampled in 1990: 106 tips and 61 internal nodes.
The reconstructed effective population size trajectories
Figure 7.
The reconstructed effective population size trajectories for (a) the 106 sequences sampled in 1990 and (b) all Sardinops melanostictus sequences. Note the y-axis is plotted in log-scale. Solid lines are the median trajectory, and dotted lines are the 95% credible band.
The serially sampled UPGMA binary genealogy of all Japanese sardine sequences.
Figure 8.
(a) The serially sampled UPGMA binary genealogy of all Japanese sardine sequences. (b) Comparison of the reconstructed Ne(t) using BNPR for the binary UPGMA and the MCMC Ne(t) for the multifurcating tree in figure 6a. Note that the TMRCA for the multifurcating tree in figure 6a is around 29 000 years versus 23 000 years for the binary genealogy shown in (a), which is why the inferred Ne(t) profiles have different ranges for t.
An example of inference of effective population size of a phylogenetic tree using BNPR under various coalescent models.
Figure 9.
An example of inference of effective population size of a phylogenetic tree using BNPR under various coalescent models.
Log total coalescent rate when there are lineages.
Figure 10.
Log total coalescent rate when there are b lineages. Solid lines show the true value for different values of b and dashed lines show our approximation.
Posterior distribution of for the tree
Figure 11.
Posterior distribution of α for the tree in figure 3. The blue and red lines are the mean and median values, respectively.
Trace plots for the MCMC chain for the tree in figure 3
Figure 12.
Trace plots for the MCMC chain for the tree in figure 3. The marginal trace plot for logNe(t) is taken at t5.23, which is the 70th grid point.
Boxplots of inferred values from simulations with trees generated from
Figure 13.
Boxplots of inferred α values from simulations with trees generated from (a): uniform trajectory, (b): exponential trajectory, (c): boombust trajectory. Each row is a fixed N; each column is a fixed α; and each colour is a sampling time. The black line is the true α.
The three ‘true’ genealogies used for simulation
Figure 14.
The three ’true’ genealogies used for simulation. Each was generated under a Beta-coalescent with α=1.5 and an exponential effective population size trajectory.
Results of inferred
Figure 15.
Results of inferred α and Ne(t) values under the block-size MLE, hybrid and MCMC methods based on reconstructed genealogies. (a) Scatterplots of inferred α values: the horizontal line is the true α=1.5. (b) Scatterplots of the coverage of the 95% credible intervals of the inferred Ne(t) values. (c) Scatterplots of the log10 MSE of the inferred Ne(t) values. Note the red triangles in each figure represent the value from applying our methods on the true genealogy in figure 14. The green and blue colours represent the fast mutation scenario, and the original mutation scenario, respectively.

Similar articles

Cited by

References

    1. Kingman JFC. 1982. The coalescent. Stoch. Process. Their Appl. 13, 235–248. (10.1016/0304-4149(82)90011-4) - DOI
    1. Slatkin M. 2001. Simulating genealogies of selected alleles in a population of variable size. Genet. Res. 78, 49–57. (10.1017/s0016672301005183) - DOI - PubMed
    1. Wakeley J. 2009. Coalescent theory: an introduction. Greenwood Village, CO: Roberts and Co.
    1. Menardo F, Gagneux S, Freund F. 2021. Multiple merger genealogies in outbreaks of Mycobacterium tuberculosis. Mol. Biol. Evol. 38, 290–306. (10.1093/molbev/msaa179) - DOI - PMC - PubMed
    1. Li LM, Grassly NC, Fraser C. 2017. Quantifying transmission heterogeneity using both pathogen phylogenies and incidence time series. Mol. Biol. Evol. 34, 2982–2995. (10.1093/molbev/msx195) - DOI - PMC - PubMed

LinkOut - more resources