

Linking volatile metabolites from bacterial pathogens to exhaled breath condensate of people with cystic fibrosis
- PMID: 39976612
- PMCID: PMC12282304
- DOI: 10.1099/mic.0.001536
Linking volatile metabolites from bacterial pathogens to exhaled breath condensate of people with cystic fibrosis
Abstract
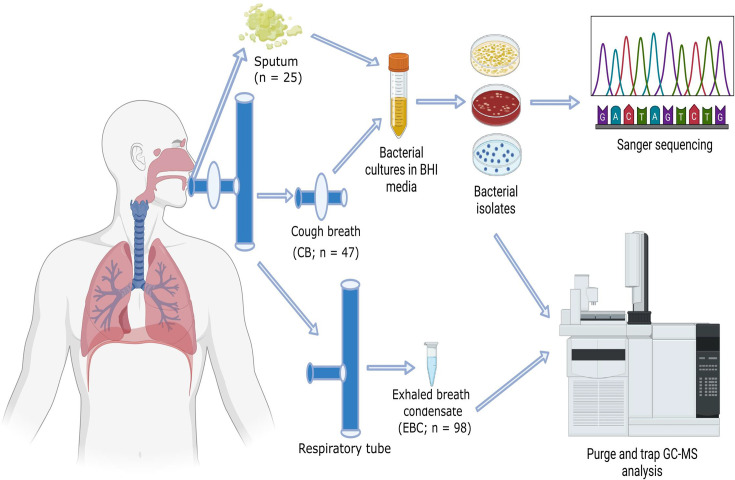
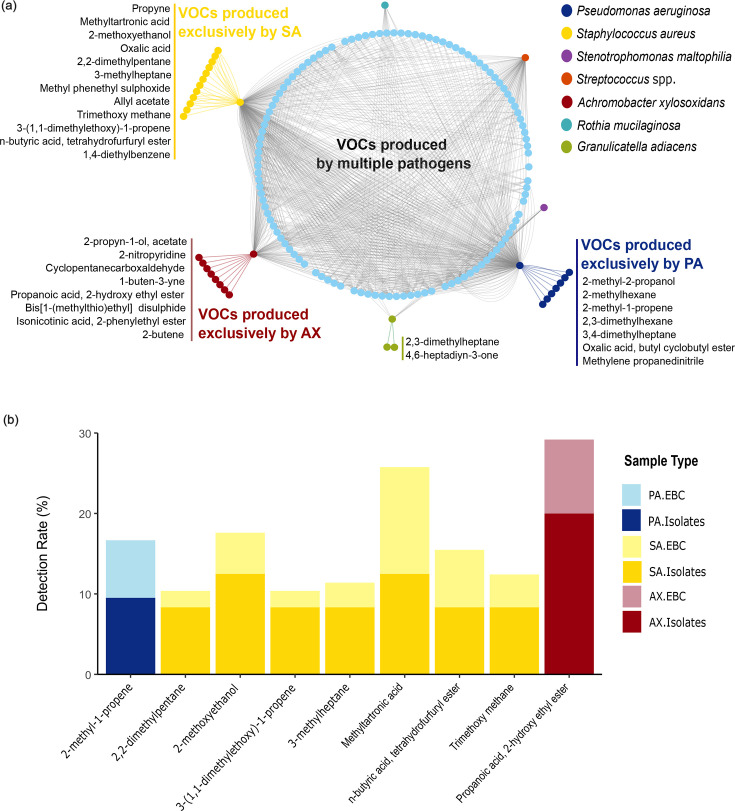
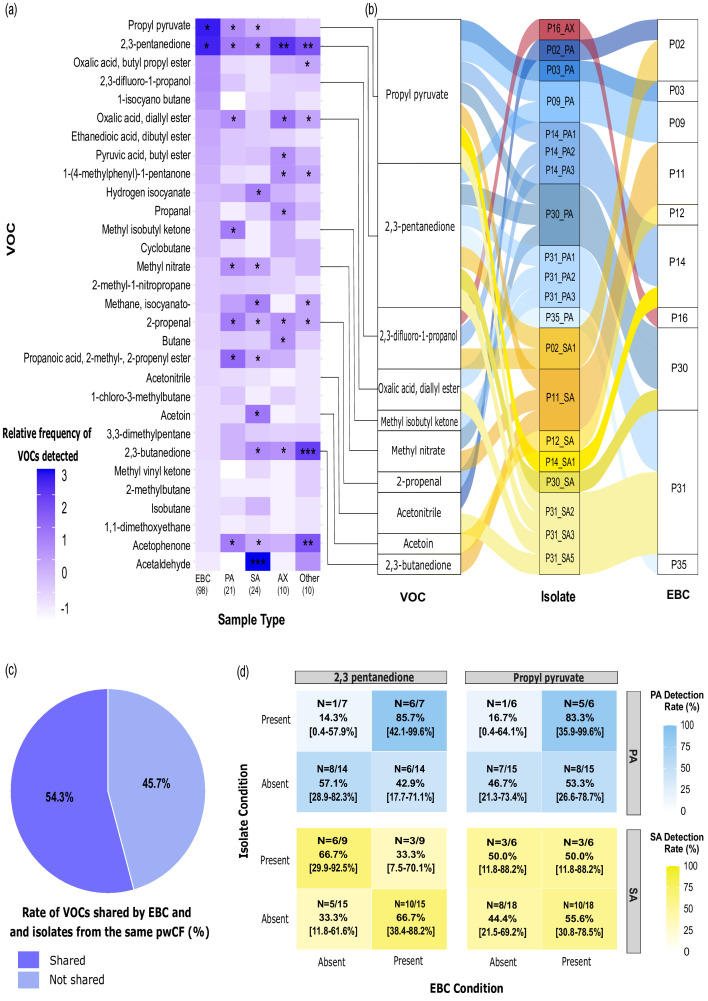
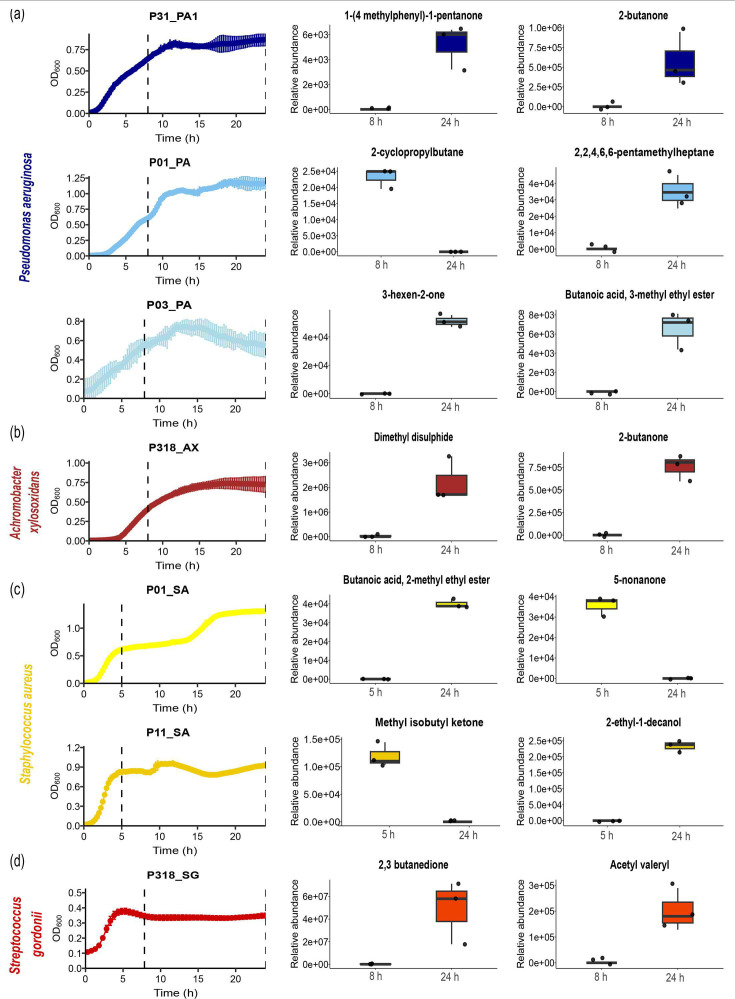
Obtaining sputum samples from people with cystic fibrosis (pwCF) for microbiology has become challenging due to the positive clinical effects of the cystic fibrosis transmembrane conductance regulator modulator therapy, elexacaftor-tezacaftor-ivacaftor (ETI). Although ETI improves lung function and reduces sputum production, recent data shows that bacterial pathogens persist, making continued monitoring of infection important. As an alternative to sputum sampling, this study developed a non-invasive technique called 'Cough Breath' (CB) to identify volatile organic compounds (VOCs) in exhaled breath condensate (EBC) and link them to cystic fibrosis (CF) bacterial pathogens using purge and trap GC-MS. The CB culturing approach was able to isolate pathogens from expectorated particulates simultaneously with EBC collection; however, culturing positivity was low, with 6% of samples collected (n=47) positive for either Pseudomonas aeruginosa or Staphylococcus aureus. From EBC, we identified VOCs matching those uniquely produced by P. aeruginosa (7), S. aureus (12), Achromobacter xylosoxidans (8) and Granulicatella adiacens (2); however, the overall detection rate was also low. Expanding to VOCs produced across multiple pathogens identified 30 frequently detected in the EBC of pwCF, including 2,3-pentanedione, propyl pyruvate, oxalic acid diallyl ester, methyl isobutyl ketone, methyl nitrate, 2-propenal, acetonitrile, acetoin and 2,3-butanedione. Comparing isolate volatilomes and EBC samples from the same pwCF enhanced detection rates with key VOCs, such as 2,3-pentanedione (86%) and propyl pyruvate (83%), in P. aeruginosa isolates. Further investigation showed that VOC production differed across strains and at different growth phases, creating variability that may explain the overall low EBC detection rate. Although this study successfully cultured CF pathogens from cough particulates and matched their unique VOCs in EBC samples, our results indicate that microbial volatiles more generally indicative of infection, such as 2,3-pentanedione, may have the most utility in aiding diagnostics in pwCF on ETI who have reduced sputum production in the clinic.
Keywords: cough breath; cystic fibrosis; exhaled breath condensate; pathogens; volatile organic compounds.
Conflict of interest statement
The authors declare that there are no conflicts of interest.
Figures
Similar articles
-
Corrector therapies (with or without potentiators) for people with cystic fibrosis with class II CFTR gene variants (most commonly F508del).Cochrane Database Syst Rev. 2023 Nov 20;11(11):CD010966. doi: 10.1002/14651858.CD010966.pub4. Cochrane Database Syst Rev. 2023. PMID: 37983082 Free PMC article.
-
Bronchoscopy-guided antimicrobial therapy for cystic fibrosis.Cochrane Database Syst Rev. 2024 May 3;5(5):CD009530. doi: 10.1002/14651858.CD009530.pub5. Cochrane Database Syst Rev. 2024. PMID: 38700027 Free PMC article.
-
Antibiotic treatment for non-tuberculous mycobacteria lung infection in people with cystic fibrosis.Cochrane Database Syst Rev. 2025 Mar 27;3(3):CD016039. doi: 10.1002/14651858.CD016039. Cochrane Database Syst Rev. 2025. PMID: 40145528
-
Bronchoscopy-guided antimicrobial therapy for cystic fibrosis.Cochrane Database Syst Rev. 2013 Dec 23;(12):CD009530. doi: 10.1002/14651858.CD009530.pub2. Cochrane Database Syst Rev. 2013. Update in: Cochrane Database Syst Rev. 2016 Jan 21;(1):CD009530. doi: 10.1002/14651858.CD009530.pub3. PMID: 24363033 Updated.
-
Bronchoscopy-guided antimicrobial therapy for cystic fibrosis.Cochrane Database Syst Rev. 2016 Jan 21;(1):CD009530. doi: 10.1002/14651858.CD009530.pub3. Cochrane Database Syst Rev. 2016. Update in: Cochrane Database Syst Rev. 2018 Sep 17;9:CD009530. doi: 10.1002/14651858.CD009530.pub4. PMID: 26797965 Updated.
References
-
- Rogers GB, Carroll MP, Serisier DJ, Hockey PM, Jones G, et al. Characterization of bacterial community diversity in cystic fibrosis lung infections by use of 16S ribosomal DNA terminal restriction fragment length polymorphism profiling. J Clin Microbiol. 2004;42:5176–5183. doi: 10.1128/JCM.42.11.5176-5183.2004. - DOI - PMC - PubMed
MeSH terms
Substances
Grants and funding
LinkOut - more resources
Full Text Sources
Medical
Research Materials
Miscellaneous