. 2025 Feb 25;122(8):e2421717122.
doi: 10.1073/pnas.2421717122. Epub 2025 Feb 20.

The endocannabinoid 2-arachidonoylglycerol is released and transported on demand via extracellular microvesicles

Affiliations

The endocannabinoid 2-arachidonoylglycerol is released and transported on demand via extracellular microvesicles

Verena M Straub et al. Proc Natl Acad Sci U S A. .

Abstract

While it is known that endocannabinoids (eCB) modulate multiple neuronal functions, the molecular mechanism governing their release and transport remains elusive. Here, we propose an "on-demand release" model, wherein the formation of microvesicles, a specific group of extracellular vesicles (EVs) containing the eCB, 2-arachidonoylglycerol (2-AG), is an important step. A coculture model system that combines a reporter cell line expressing the fluorescent eCB sensor, G protein-coupled receptor-based (GRAB)eCB2.0, and neuronal cells revealed that neurons release EVs containing 2-AG, but not anandamide, in a stimulus-dependent process regulated by protein kinase C, Diacylglycerol lipase, Adenosinediphosphate (ADP) ribosylation factor 6 (Arf6), and which was sensitive to inhibitors of eCB facilitated diffusion. A vesicle contained approximately 2,000 2-AG molecules. Accordingly, hippocampal eCB-mediated synaptic plasticity was modulated by Arf6 and transport inhibitors. The "on-demand release" model, supported by mathematical analysis, offers a cohesive framework for understanding eCB trafficking at the molecular level and suggests that microvesicles carrying signaling lipids in their membrane regulate neuronal functions in parallel to canonical synaptic vesicles.

Keywords: 2-AG; cannabinoid 1 receptors; diacylglycerol lipase; endocannabinoid; extracellular vesicle.


Conflict of interest statement

Competing interests statement:The authors declare no competing interest.

Figures

Fig. 1.
Fig. 1.
GRABeCB2.0-based coculture assay to study transcellular 2-AG signaling. (A) Schematic representation of the transcellular endocannabinoid transport assay. HEK293T cells expressing GRABeCB2.0 are paired with wild-type Neuro2A cells. Activation of purinergic P2X7 receptors (P2X7R) on Neuro2A cells by exogenous ATP triggers 2-arachidonoyl glycerol (2-AG) production and release. 2-AG released from Neuro2A cells is free to travel and activate GRABeCB2.0 on HEK293T cells. (B) Representative confocal images and traces of HEK293T cells transiently expressing GRABeCB2.0 or GRABeCB2.0mut and Neuro2A cells transiently expressing CD9-mScarletI. Cells were treated with 1 mM ATP. After 20 min, 10 µM CB1 agonist (−)CP-55,940 was added. Traces show mean ΔF/F0 ± SEM. n = 3/4 regions of interest for eCB2.0/eCB2.0mut. (Scale bars are 20 µm.) (C) Traces of different number of HEK293TeCB2.0 (H) and Neuro2A (N) cells after treatment with vehicle or 1 mM ATP. (D) Area under the curve (AUC) of traces after ATP- or vehicle treatment. The arrow indicates optimal ratio (1:0.875, 40.000 Neuro2A + 35.000 HEK293TeCB2.0) with a maximum response to ATP and minimal background signal. Data show mean AUC ± SD. n = 3/6 (H60) wells. (E) Dose–response of GRABeCB2.0 activation in the optimized transport assay by 2-AG, anandamide (AEA), and AA. Data are mean ± SD, pEC50 values are mean ± SEM [n = 2 (2-AG, AEA)/3 (AA) well plates]. (F and G) Representative traces (F) and AUC of fluorescent changes (ΔF/F0) (G) of cells treated with DMSO or Rimonabant (n = 3 well plates). (H and I) Same as (F and G) but cells were treated with DMSO or A-740003 (n = 4 well plates). (J and K) Same as (F and G) but cells were treated with DMSO or A-740003 (n = 4 well plates). Traces are shown as mean ± SD (n = 6 wells). AUC was calculated as percentage of vehicle-corrected ATP-response and is shown as mean ± SD. Statistical analysis was performed using a two-tailed t test. ***P < 0.001.
Fig. 2.
Fig. 2.
Pharmacological screening reveals regulators of 2-AG release and transport. (A and B) Representative traces (A) and AUC of fluorescent changes (ΔF/F0) (B) of cells treated with DMSO, Sotrastaurin or PMA (n = 5/3/4 DMSO/Sotrastaurin/PMA). (C and D) Same as (A and B) but cells were treated with EtOH or WOBE437 (n = 4/3/4/4 EtOH/3 µM/10 µM/30 µM). (E and F) Same as (A and B) but cells were treated with EtOH or OMDM-2 (n = 3). (G and H) Same as (A and B) but cells were treated with EtOH or VDM11 (n = 4). (I and J) Same as (A and B) but cells were treated with DMSO or SBFI-26 (n = 6). (K and L) Same as (A and B) but cells were treated with DMSO or SecinH3 (n = 7/5/5/7 DMSO/1 µM/3 µM/10 µM). (M and N) Same as (A and B) but cells were treated with DMSO or NAV2729 (n = 2). (O and P) Same as (A and B) but cells were treated with DMSO or ML-7 (n = 5/4/3/5 DMSO/3 µM/10 µM/30 µM.). AUC was calculated as percentage of vehicle-corrected ATP-response. Data are shown as mean ± SD. Statistical analysis was performed using one-way ANOVA with Tukey’s correction for multiple comparisons. n for traces is individual wells and n for AUC is independent well plates. *P < 0.05, **P < 0.01, ***P < 0.001.
Fig. 3.
Fig. 3.
ATP stimulates P2X7R-dependent microvesicle release from Neuro2A cells. (A) Schematic representation of EV isolation process. Release of EVs is stimulated by 1 mM ATP for 30 min under serum-free conditions. Cell culture supernatant is collected and cleared from cells and cell debris. Supernatant is concentrated to 500 µL using 100 kDa centrifugal filters. EVs are separated from free protein by size-exclusion chromatography (SEC) using Izon qEV 30 nm columns. Created with biorender.com. (B) Representative western blot of cell lysates and EVs following treatment with DMSO or 10 µM A-740003 (20 min, 37 °C) and stimulation with 1 mM ATP or MQ (30 min, 37 °C). (C) Quantification of CD9 signal intensity. Fold change is calculated relative to the respective vehicle control. Data are shown as mean ± SD (n = 6 independent biological experiments). Statistical analysis was performed using matched one-way ANOVA with Tukey’s correction for multiple comparisons. (D) Representative size distribution of EVs determined by nanoparticle tracking analysis. Data is mean ± SD (n = 3 videos). (EG) Fold change of particle concentration (E), mode size (F), and mean size (G) of EVs as determined by NTA. Data are shown as mean ± SD (n = 3 independent biological experiments). Statistical analysis in (E) was performed using a two-tailed t test. (H) Gene ontology enrichment analysis for cellular compartment of proteins enriched >10-fold in EVs compared to Neuro2A cell lysate as determined by LC-MS/MS-based proteomics. (I) 5,181 proteins were identified in EVs. Fold change of protein intensity in EVs compared to Neuro2A cell lysate is shown. Proteins of interest are highlighted. (J) Scaled protein abundance of selected proteins in EVs and Neuro2A cells (N2A). EV1-3 and N2A1-3 represent biological replicates. *P < 0.05, **P < 0.01, ***P < 0.001.
Fig. 4.
Fig. 4.
2-AG is specifically sorted into microvesicles in a DAGL- and Arf6-dependent process. (A and B) Fold-enrichment (ATP/Vehicle) of lipids in EVs (A) or cells (B) following vehicle (MQ) or ATP-treatment for 30 min at 37 °C. (C) Size distribution of EVs determined by nanoparticle tracking analysis (NTA) (n = 3 videos). (D) Representative western blot and (E) quantification of CD9 signal intensity in EVs (n = 9). (F and G) 2-AG levels in EVs (F) and cells (G) relative to vehicle-treated control (n = 10/7 DMSO/DH376). (H) Size distribution of EVs determined by nanoparticle tracking analysis (NTA) (n = 3 videos). (I) Representative western blot and (J) quantification of CD9 signal intensity in EVs (n = 7). (K and L) 2-AG levels in EVs (K) and cells (L) relative to vehicle-treated control (n = 3). Cells were treated with 1 µM DH376 (CG) or 10 µM SecinH3 (HL) for 20 min prior to vehicle (MQ) or ATP-treatment for 30 min at 37 °C, followed by EV isolation. Data are shown as mean ± SD. n is individual biological replicates/EV isolations. Statistical testing was performed using one-way ANOVA with Tukey’s correction for multiple comparisons. *P < 0.05, **P < 0.01, ***P < 0.001, ns not significant P > 0.05.
Fig. 5.
Fig. 5.
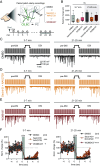
Inhibition Arf6 and facilitated diffusion affects 2-AG-dependent phasic endocannabinoid signaling ex vivo. (A) Schematic illustration of experimental design. Paired patch-clamp recordings were conducted in acute hippocampal slices between CB1-positive basket cells (CB1BC) and PC. The intracellular solution for the postsynaptic cell contained either vehicle DMSO, SecinH3 and NAV2729 or WOBE437 in the pipette. DSI was induced with 1 s depolarization of the postsynaptic cell in every 2 min after the start of the experiment. The timeline of the experiment represents analyzed time windows. (B) Summary graphs of baseline synaptic charge between pairs. (C) Representative traces of presynaptic action potential evoked (Top traces) IPSCs (Bottom traces) before and after DSI induction at 3 to 7 min and 21 to 25 min time windows. Postsynaptic intracellular solution contained vehicle 0.5% DMSO. (D) Same as (C), but postsynaptic intracellular solution contained SecinH3 (10 µM) and NAV2729 (30 µM). (E) Same as (C and D), but postsynaptic intracellular solution contained WOBE437 (10 µM). (F) Summary plots of normalized charge values before and after DSI induction at 3 to 7 min and 21 to 25 min time windows. Data show median ± IQR with individual datapoints (B) or mean (F). Statistical significance was determined by the Kruskal–Wallis test with Dunn’s multiple comparisons (B) or repeated measures one-way ANOVA with Dunnett’s multiple comparisons (F). *P < 0.05, ***P < 0.001, ns not significant P > 0.05. N = 7 animals/group n = 8/7/7 individual pairs in groups DMSO/SecinH3 and NAV2729/WOBE437, respectively.
Fig. 6.
Fig. 6.
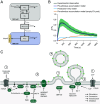
Model for on-demand 2-AG release in extracellular microvesicles. (A) Schematic of the mathematical compartmental model to approximate GRABeCB2.0 activation in the endocannabinoid transport assay. (B) Model fitting shows that the implementation of a preformed EV pool is important to describe the formation of the observed signal peak. A model that only takes 2-AG production into account was unable to capture the dynamics of the signal peak. (C) Scheme on the on-demand release model (1) Stimulation of the cell leads to lipid shuffling and cytoskeleton rearrangements, resulting in the formation of a budding plasma membrane microvesicle. (2) 2-AG is loaded into forming microvesicles. This process is regulated by production of 2-AG by DAGLα; PKC-dependent endocytosis of DAGLα; translocation of 2-AG within the lipid bilayer by an unidentified endocannabinoid transporter; and intracellular endocannabinoid transport proteins. (3) Release of budding vesicles through membrane fission is controlled by Arf6- and MLCK-activity. (4) 2-AG containing extracellular vesicles released into the extracellular space mediate cell-to-cell communication and may be taken up by various cell types to terminate endocannabinoid signaling. 2-AG: 2-arachidonoylglycerol, Arf6: ADP-ribosylation factor 6, ATP: Adenosine triphosphate, DAG: Diacyl glycerol, DAGLα: DAG lipase α, DHPG: (S)-3,5-dihydroxyphenylglycine, EMT: Endocannabinoid membrane transporter, FABP5: Fatty-acid binding protein 5, Gq: Heterotrimeric G protein alpha subunit q, mGluR: Metabotropic glutamate receptor, MLCK: Myosin light chain kinase, P2X7R: P2X7 receptor, PIP2: Phosphatidylinositol-4,5-bisphosphate, PKC: Protein kinase C, PLC-β: Phospholipase C-β, PMA: Phorbol 12-myristate 13-acetate. Created with biorender.com.

References

    1. Südhof T. C., Neurotransmitter release: The last millisecond in the life of a synaptic vesicle. Neuron 80, 675–690 (2013). - PMC - PubMed
    1. Piomelli D., Astarita G., Rapaka R., A neuroscientist’s guide to lipidomics. Nat. Rev. Neurosci. 8, 743–754 (2007). - PubMed
    1. Alger B. E., Kim J., Supply and demand for endocannabinoids. Trends Neurosci. 34, 304–315 (2011). - PMC - PubMed
    1. Marsicano G., et al. , CB1 cannabinoid receptors and on-demand defense against excitotoxicity. Science 302, 84–88 (2003). - PubMed
    1. Kreitzer A. C., Regehr W. G., Retrograde inhibition of presynaptic calcium influx by endogenous cannabinoids at excitatory synapses onto Purkinje cells. Neuron 29, 717–727 (2001). - PubMed

LinkOut - more resources