. 2025 Feb 21;387(6736):eadp2407.
doi: 10.1126/science.adp2407. Epub 2025 Feb 21.

Disease diagnostics using machine learning of B cell and T cell receptor sequences

Affiliations

Disease diagnostics using machine learning of B cell and T cell receptor sequences

Maxim E Zaslavsky et al. Science. .

Abstract

Clinical diagnosis typically incorporates physical examination, patient history, various laboratory tests, and imaging studies but makes limited use of the human immune system's own record of antigen exposures encoded by receptors on B cells and T cells. We analyzed immune receptor datasets from 593 individuals to develop MAchine Learning for Immunological Diagnosis, an interpretive framework to screen for multiple illnesses simultaneously or precisely test for one condition. This approach detects specific infections, autoimmune disorders, vaccine responses, and disease severity differences. Human-interpretable features of the model recapitulate known immune responses to severe acute respiratory syndrome coronavirus 2, influenza, and human immunodeficiency virus, highlight antigen-specific receptors, and reveal distinct characteristics of systemic lupus erythematosus and type-1 diabetes autoreactivity. This analysis framework has broad potential for scientific and clinical interpretation of immune responses.


Figures
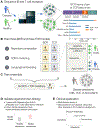
Fig. 1.
Fig. 1.. MAchine Learning for Immunological Diagnosis (Mal-ID) framework.
(A) BCR heavy chain and TCR beta chain gene repertoires are amplified and sequenced from blood samples of individuals with different disease states. Question marks indicate that most sequences from patients are not disease specific. (B) Machine learning models are trained to predict disease using several immune repertoire feature representations. These include protein language models, which convert each amino acid sequence into a numerical vector. (C) An ensemble disease predictor is trained using the three BCR and three TCR base models. The combined model predicts disease status of held-out test individuals. (D) For validation, the disease prediction model allows introspection of which V genes carry disease-specific signal, which can be validated against prior literature. Within each V gene, previously published BCR and TCR sequences known to be disease associated can be tested for whether they have higher disease association. (E) The final trained model can be applied as a multi-disease assay, or as a diagnostic test for one disease. The same model will achieve a range of sensitivities and specificities depending on the chosen decision threshold.
Fig. 2.
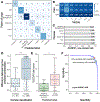
Fig. 2.. Mal-ID classifies disease using IgH and TRB sequences.
(A) Disease classification performance on held-out test data by the ensemble of three B cell repertoire and three T cell repertoire machine learning models, combined over all cross-validation folds. The number of predictions (values in boxes) for each combination of true and predicted labels is shown, for a total of n=550 paired BCR and TCR samples. (B) Disease classification performance, calculated as multi-class one-vs-one area under the receiver operating curve (AUROC) scores, divided column-wise by model architecture (individual base models or ensembles of base models) and row-wise by whether BCR data, TCR data, or both were incorporated. Model 1 refers to the repertoire composition classifier, model 2 refers to the CDR3 clustering classifier, and model 3 refers to the protein language model classifier. The CDR3 clustering models abstain from prediction on some samples, while the other models do not abstain; to make the scores comparable, abstentions were forcibly applied to the other models. The BCR-only results also include BCR-only patient cohorts (n=66 samples) not present in TCR-only or BCR+TCR evaluation. (C) AUROC scores for each class versus the rest from the full ensemble architecture including models 1, 2, and 3 with both BCR and TCR data. (D) Difference of probabilities of the top two predicted classes for correct versus incorrect ensemble model predictions. A higher difference implies that the model is more certain in its decision to predict the winning disease label, whereas a low difference suggests that the top two possible predictions were a toss-up. Results were combined across all cross-validation folds. Each box represents the interquartile range (IQR) between the 25th and 75th percentiles of the data, with the line inside the box representing the median value. Whiskers extend to the farthest values within 1.5 times the IQR from the edges of the box. Data points represent individual samples, with total sample number n indicated below each boxplot. One-sided Wilcoxon rank-sum test: p value 1.599 x 10⁻¹⁵, U-statistic 6052. (E) SLEDAI clinical disease activity scores for adult lupus patients who were either classified correctly or misclassified as healthy by the BCR-only ensemble model, used here because the adult lupus data was primarily BCR-only. SLEDAI scores were only available for some patients. Boxes represent data interquartile ranges with median lines, and whiskers show data extremes up to 1.5 times the IQR from the box. Data points represent individual samples, with total sample number n indicated below each boxplot. One-sided Wilcoxon rank-sum test: p value 4.242 x 10⁻³, U-statistic 48. (F) Sensitivity versus specificity, averaged over three cross-validation folds, for a lupus diagnostic classifier derived from the pan-disease classifier. Two possible decision thresholds are highlighted. *P < 0.05, **P < 0.01, ***P < 0.001, and ****P < 0.0001.
Fig. 3:
Fig. 3:. Disease-associated IGHV genes and isotypes prioritized by Model 3 using protein language embeddings.
Shapley importance (SHAP) values quantifying the contribution of average sequence predictions from each IGHV gene and isotype category to Model 3’s prediction of a sample’s disease state are plotted for (A) Covid-19 (averaged over n=14 positive samples), (B) HIV (n=21 positive samples), (C) influenza vaccination (n=8 positive samples), (D) lupus (n=22 positive samples), and (E) type-1 diabetes (n=22 positive samples).
Fig. 4.
Fig. 4.. Models 2 and 3 learn SARS-CoV-2 antigen-specific sequence patterns from Covid-19 patient data and can distinguish between known SARS-CoV-2-specific antibody sequences and healthy donor sequences.
For this comparison, validated SARS-CoV-2-binding sequences from the CoV-AbDab database (50) and a subset of healthy donor sequences were held out from training. Known binder detection using Model 2 or Model 3 predictions of sequence association to disease was evaluated separately for each IGHV gene; performance is shown for IGHV1-24 and compared across IGHV genes. (A to D) Model 2 identifies a conservative set of public clones enriched in Covid-19 patients which match some known binders. In panels (A) and (C), the number of predictions (values in boxes) for each combination of true and predicted labels is shown for a total of n=1856 sequences that use IGHV1-24. Model 2’s precision and recall across IGHV genes is shown, with binding predictions determined: (A and B) based on shared IGHV gene, IGHJ gene, and CDR3 length with any Covid-19 cluster identified in Model 2’s training procedure; or (C and D) with an additional 85% CDR3 sequence identity threshold. (E to H) Model 3 ranks known binders higher than healthy sequences based on predicted Covid-19 probability (E), with relative AUPRC ranging up to 6.9-fold over baseline prevalence (F) and AUROC up to 0.78 across IGHV genes (G). Permutation test in panel (E) to assess whether IGHV1-24 known binders have higher ranks than healthy donor sequences, with consistent labels maintained during the permutation process across sequences from each healthy donor: p value 0. In panel (E), boxes represent interquartile ranges (IQR) with median value lines superimposed; whiskers extend to data points within 1.5 times the IQR from the box edges; and data points represent individual sequences using IGHV1-24, with total sequence number n indicated below each boxplot. (H) Model 3 maintains reasonable performance (AUROC up to 0.75) for sequences that are not evaluated by Model 2’s clustering (sequences for which Model 2 identified no SARS-CoV-2 clusters with matching IGHV gene, IGHJ gene, and CDR3 length). (I) At equivalent precision, Model 3 generally exhibits higher recall than Model 2, identifying more true binders but with increased false positives. IGHV genes where Model 3 has higher recall than Model 2 are shown in blue. For each IGHV gene, recall was calculated for Models 2 and 3 at Model 2’s precision shown in (B), with no sequence identity constraint applied during matching to Model 2 clusters. Data points represent n=34 individual V genes in panels (B), (D), (F), (G), (H), and (I). Point size indicates number of identical values plotted at a particular location for panels (B), (D), and (I). *P < 0.05, **P < 0.01, ***P < 0.001, and ****P < 0.0001.

Update of

  • Disease diagnostics using machine learning of immune receptors.
    Zaslavsky ME, Craig E, Michuda JK, Sehgal N, Ram-Mohan N, Lee JY, Nguyen KD, Hoh RA, Pham TD, Röltgen K, Lam B, Parsons ES, Macwana SR, DeJager W, Drapeau EM, Roskin KM, Cunningham-Rundles C, Moody MA, Haynes BF, Goldman JD, Heath JR, Nadeau KC, Pinsky BA, Blish CA, Hensley SE, Jensen K, Meyer E, Balboni I, Utz PJ, Merrill JT, Guthridge JM, James JA, Yang S, Tibshirani R, Kundaje A, Boyd SD. Zaslavsky ME, et al. bioRxiv [Preprint]. 2024 Apr 3:2022.04.26.489314. doi: 10.1101/2022.04.26.489314. bioRxiv. 2024. Update in: Science. 2025 Feb 21;387(6736):eadp2407. doi: 10.1126/science.adp2407. PMID: 35547855 Free PMC article. Updated. Preprint.

References

    1. Charlton CL, Babady E, Ginocchio CC, Hatchette TF, Jerris RC, Li Y, Loeffelholz M, McCarter YS, Miller MB, Novak-Weekley S, Schuetz AN, Tang Y-W, Widen R, Drews SJ, Practical Guidance for Clinical Microbiology Laboratories: Viruses Causing Acute Respiratory Tract Infections. Clin. Microbiol. Rev 32 (2019). - PMC - PubMed
    1. Milo R, Miller A, Revised diagnostic criteria of multiple sclerosis. Autoimmun. Rev 13, 518–524 (2014). - PubMed
    1. Kavanaugh A, Tomar R, Reveille J, Solomon DH, Homburger HA, Guidelines for clinical use of the antinuclear antibody test and tests for specific autoantibodies to nuclear antigens. Arch. Pathol. Lab. Med 124, 71–81 (2000). - PubMed
    1. Nielsen SCA, Boyd SD, Human adaptive immune receptor repertoire analysis-Past, present, and future. Immunol. Rev 284, 9–23 (2018). - PubMed
    1. Arnaout RA, Prak ETL, Schwab N, Rubelt F, Adaptive Immune Receptor Repertoire Community, The Future of Blood Testing Is the Immunome. Front. Immunol 12, 626793 (2021). - PMC - PubMed

MeSH terms

Substances