. 2025 Feb 21;387(6736):eadq2677.
doi: 10.1126/science.adq2677. Epub 2025 Feb 21.

Reviving-like prosocial behavior in response to unconscious or dead conspecifics in rodents

Affiliations

Reviving-like prosocial behavior in response to unconscious or dead conspecifics in rodents

Wenjian Sun et al. Science. .

Abstract

Whereas humans exhibit emergency responses to assist unconscious individuals, how nonhuman animals react to unresponsive conspecifics is less well understood. We report that mice exhibit stereotypic behaviors toward unconscious or dead social partners, which escalate from sniffing and grooming to more forceful actions such as mouth or tongue biting and tongue pulling. The latter intense actions, more prominent in familiar pairs, begin after prolonged immobility and unresponsiveness and cease when the partner regains activity. Their consequences, including improved airway opening and clearance and accelerated recovery from unconsciousness, suggest rescue-like efforts. Oxytocin neurons in the hypothalamic paraventricular nucleus respond differentially to the presence of unconscious versus active partners, and their activation, along with oxytocin signaling, is required for the reviving-like actions. This tendency to assist unresponsive members may enhance group cohesion and survival of social species.


Conflict of interest statement

Competing interests: The authors declare no competing interests.

Figures

Fig. 1.
Fig. 1.. A stereotypic set of behaviors directed towards an unconscious social partner.
(A) Schematic of behavioral setup. (B) Example pose estimation by identifying key points. (C) Schematic of the workflow for action prediction and annotation. (D) Total interaction time with the partner. Unpaired t test, ****P < 0.0001, n = 10 and 22 mice for active and unresponsive groups respectively. (E) Schematic of different body parts. (F) Cumulative durations of actions directed towards different body parts. Columns represent mean ± SEM. Unpaired t test, *P < 0.05, ***P < 0.001, ****P < 0.0001, “ns”, not significant, n = 10 and 22 mice in active and unresponsive groups respectively. (G) Proportions of total testing time devoted to actions directed towards different body parts. (H) Clustering of different types of actions (labeled by different colors; blue, sniffing, beige, grooming, red, mouth/eye interaction). PC, principal component. (I) Ethogram of different actions for an example subject mouse. (J to K) Probabilities (J) and cumulative durations (K) of different types of actions over time for the same animal. (L) Ethograms for five example subject mice in active (upper) and unresponsive (lower) groups. (M) Population average of cumulative duration for different types of actions. Note that grooming and mouth/eye-targeted actions were absent in the active group. Shade represents SEM. n = 5 animals in each group. (N) Total durations of sniffing, grooming, and mouth/eye interaction toward active (circle) or unresponsive (triangle) partners. Columns represent mean ± SEM. Two-way ANOVA with Tukey’s multiple comparisons test, ****P < 0.0001, “ns”, not significant, n = 10 and 22 animals in active and unresponsive groups respectively. (O) Proportions of total interaction time devoted to different types of actions in active (upper) and unresponsive (lower) groups. Blue, sniffing, beige, grooming, red, mouth/eye interactions. For statistical details, see table S1.
Fig. 2.
Fig. 2.. Behavioral time course and reactions to other states of partners.
(A) Top row, epochs of active (black) and immobilized (gray) states in the partners aligned with the timing of complete immobilization (marked by the vertical dotted line). Lower three rows, epochs of annotated actions (blue, sniffing, beige, grooming, red, mouth/eye interactions) in the subjects. (B to D) Mean probability of sniffing (B), grooming (C) and mouth/eye interactions (D) aligned with the timing of complete immobility (timepoint 0). Insets, average probability of sniffing, grooming, and mouth/eye interactions within different time windows. One-way RM ANOVA with Tukey’s multiple comparisons test, *P < 0.05, **P < 0.01, ****P < 0.0001, “ns”, not significant, n = 5 animals in each group. (E) Top row, epochs of active (black) and immobilized (gray) states in the partners aligned with the timing of the partners’ first movement (marked by the vertical dotted line). Lower three rows, epochs of annotated actions (blue, sniffing; beige, grooming; red, mouth/eye interactions) from the subjects. (F to H) Mean probability of sniffing (F), grooming (G), and mouth/eye interactions (H) aligned with the timing of the partners’ first movement (time 0). Insets, average probability of sniffing, grooming, and mouth/eye interactions before vs. after the partners’ first movement. Wilcoxon test, *P < 0.05, **P < 0.01, n = 9 animals in each group. (I) Schematic (left) and ethogram (middle) of subject mice’s responses to a dead partner, and quantifications of total duration of sniffing, grooming, and mouth/eye interaction towards anesthetized vs. dead partners (right). Two-way ANOVA with Tukey’s multiple comparisons test, “ns”, not significant, n = 6 and 22 animals in dead and anesthetized groups respectively. (J) Similar to (I) but for actions towards sleeping partners. Two-way ANOVA with Tukey’s multiple comparisons test, “ns”, not significant, *P = 0.0388, ****P < 0.0001, n = 6 and 22 animals in sleeping and anesthetized groups respectively. For statistical details, see table S1.
Fig. 3.
Fig. 3.. The mouth/eye-targeting actions and their reviving-like effects.
(A) Percentage of animals exhibiting different mouth/eye interactions. (B) Fraction time of the total duration of different mouth/eye interactions. (C) Sample images showing the mouth region of an unresponsive partner before and after mouth biting and tongue pulling bouts from the subject mouse. White arrow marks the tongue. Right, percentage incidence of tongue being pulled out without and with a subject. Chi-square test, P = 0.0029. (D) Quantification of airway size in mice without and with the tongue pulled out (after fixation). Unpaired t test, ***P = 0.0002, n = 6 mice in each group. (E) Sample images showing a foreign body in the mouth before and after being removed. (F) Ethogram for an example subject mouse. (G) Left, percentage incidence of a foreign object being removed from the mouth (pink) with (upper) and without (lower) a subject. Right, percentage incidence of a foreign object being removed from the genital. (H) Raster plots (upper) and event-time histogram (lower) for the partner’s body twitching response from 5 pairs of animals. (I) Proportions of action bouts associated with twitching (black) or no twitching (gray). (J) Cross-correlograms between actions and twitching. Bin size, 1s. Positive values mean that twitch occurred after the initiation of actions. (K) Temporal correlations between different actions and twitching. (L) Left, schematic test of stimulation threshold for induing twitching responses in an unresponsive animal with Von Frey filaments. Middle and right, stimulation threshold at different body parts in lightly and deeply anesthetized animals. One-way ANOVA with Tukey’s multiple comparison test, ****P < 0.0001, n = 7 (left) or 5 (right) animals in each group. (M) Numbers of stimulations at different body parts to induce righting reflex in lightly anesthetized mice with a 4g Von Frey filament. One-way ANOVA with Tukey’s multiple comparison test, ****P < 0.0001, n = 6, 6, 4 and 4 animals from left to right. (N) Left, schematic of experimental conditions. Right, latencies for exhibiting the first walk without (grey) and with (pink) a subject mouse. Unpaired t test, *P = 0.015, n = 13 and 9 animals from left to right. For statistical details, see table S1.
Fig. 4.
Fig. 4.. Factors of familiarity and sex and other features.
(A to B) Ethograms for the subject’s actions towards an unresponsive conspecific for female-female, male-male, female-male, and male-female pairings in familiar (A) and unfamiliar (B) conditions. Blue, sniffing; beige, grooming; red, mouth/eye interactions. (C to D) Probability of sniffing (top), grooming (middle), and mouth/eye interactions (bottom) in familiar (C) and unfamiliar (D) conditions. Shade represents SEM. (E to G) Total durations of sniffing (E), grooming (F) and mouth/eye interactions (G) towards unresponsive conspecifics in familiar and unfamiliar conditions. Unpaired t test, ****P < 0.0001, ns, not significant, n = 33 and 20 animals in familiar and unfamiliar groups. (H to J) Total durations of sniffing (H), grooming (I) and mouth/eye interactions (J) towards unresponsive conspecifics for female-female, male-male, female-male, and male-female pairings in familiar conditions. One way ANOVA, ns, not significant, n = 11, 10, 5, and 7 animals from left to right. (K to M) Similar to (H to J) but for unfamiliar conditions. One way ANOVA with Tukey’s multiple comparisons test, *P < 0.05, **P < 0.01, ***P < 0.001, n = 5 animals in each group. (N) Schematic three-chamber social preference test (unresponsive vs. active, left) and movement tracking traces (right) for an example subject mouse. (O) Fraction of time spent in the side chamber containing an unresponsive vs. active partner. Paired t test, **P = 0.003, n = 5 animals. (P) Fraction of time spent in the left vs. right side chamber with both containing an active partner. Paired t test, P = 0.3665, n = 7 animals. (Q) Schematic repeated exposure test over 5 consecutive days (left) and total duration of interactions in each day (right). One-way ANOVA, P = 0.0726, n = 5 animals. For statistical details, see table S1.
Fig. 5.
Fig. 5.. State-selective activation of PVH oxytocin neurons.
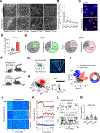
(A) Sample images showing trapped c-Fos+ cells in different brain regions of an example subject animal after exposure to an active (upper) or unresponsive (lower) partner. PVH, paraventricular hypothalamic nucleus; VMH, ventromedial hypothalamic nucleus; MEA, medial amygdalar nucleus; BLA, basolateral amygdalar nucleus; Hipp, hippocampus. Scale bars: 100 μm. (B) Fold change in the number of c-Fos+ cells in different regions after exposure to unresponsive partners relative to active ones. *P < 0.05, One-way ANOVA with Fisher’s LSD multiple comparison test, n = 3 animals. Bar represents SEM. (C) Representative images of RNAscope staining of oxytocin (magenta) and c-fos (white) in PVH after exposure to an active (upper) or unresponsive (lower) partner. Scale bars: 20 μm. (D) Number of cells in PVH that are both c-fos+ and oxt+ under two conditions. Unpaired t test, *P = 0.0390, n = 3 animals in each group. (E) Left, percentage of oxt+ neurons in PVH that are c-fos+ (green); right, percentage of c-fos+ neurons in PVH that are oxt+ (pink). n = 3 animals for each condition. (F) Schematic head-fixed in vivo optrode recording in the presence of an unresponsive (upper) or active (lower) partner. (G) Left, schematic viral injection and optrode recording in Oxt-Cre mice. Right, sample image showing expression of ChR2-EGFP in PVH. (H) An example oxytocin+ unit identified with principal component analysis (left, principal components for all detected spike waveforms from one electrode channel during one recording session) and its spikes time-locked to the laser stimuli (right, upper raw trace and lower peri-stimulus spike time histogram). (I to J) Clustering of all recorded units in PVH and the fraction of cells in each cluster (I) and heat map (J) of cells in three clusters aligned to the introduction of an unresponsive partner (vertical dotted line). N = 460 units from 3 animals. (K) Population averaged firing rates for the three clusters before and after the introduction of an unresponsive (color) or an active partner (grey). Shade represents SEM. (L) Raster plots of spikes of individual opto-tagged PVH oxytocin neurons in the presence of active (top) or unresponsive (bottom) partners. (M) Mean firing rates of oxt+ neurons under different conditions. Repeated measures (RM) one-way ANOVA with Tukey’s multiple comparisons test, **P < 0.01, ***P < 0.001, n = 33 units from 5 animals. For statistical details, see table S1.
Fig. 6.
Fig. 6.. Unresponsive vs. active state of the partner is differentially represented by population activity of PVH oxytocin neurons.
(A) Schematic microendoscope Ca2+ imaging. (B) ΔF/F traces of sample PVH oxytocin neurons in response to the introduction (color shade) of an unresponsive (left) or an active (right) partner. (C) Heatmaps (left) and population averaged curves (right) showing the Z-score of ΔF/F dynamics for four clusters of PVH oxytocin neurons in response to the introduction of an unresponsive (red) or an active (blue) partner. Both, responding to both types of partners; Unresp, preferring unresponsive partners; Active, preferring active partners; Neither, no activation to either type. n = 201 neurons from 5 sessions of 3 animals. Paired t test, unresponsive vs. active, “ns”, not significant, ****P < 0.0001, n = 22 neurons for “Both”, 103 neurons for “Unresp”, 39 neurons for “Active”, 37 neurons for “Neither”. (D) Mean Z-scores of individual sessions for unresponsive vs. active partners. Paired t test, *P < 0.05, n = 5 sessions. (E) Performance of decoders trained on the population activity of PVH oxytocin neurons in classifying unresponsive vs. active state of the partner. Unpaired t test, ****P < 0.0001, n = 125 trials in each group. (F) Population averaged Z-scores of ΔF/F dynamics (left) and the mean Z-score pre- and post-introduction of partners (right) for neurons in the “Unresp” group in response to sniffing (blue), grooming (beige), and mouth/eye interaction (red). Shade represents SEM. Bars and errors represent mean and SEM respectively. Paired t test, ns, not significant, ****P < 0.0001, n = 103 neurons. (G to H) Heatmaps (G) and population averaged curves (H) of the Z-scored ΔF/F dynamics for the three clusters in the “Unresp” group, aligned to the onset (time 0) of sniffing, grooming, or mouth/eye interaction. Shade represents SEM. (I) Mean Z-scores of ΔF/F dynamics before vs. after the onset of sniffing (blue), grooming (beige), and mouth/eye interaction (red) for the three clusters shown in (H). Two-way RM ANOVA with Fisher’s LSD multiple comparisons test, ns, not significant, *P < 0.05, **P < 0.01, ***P < 0.001, ****P < 0.0001, n = 52, 35 and 16 neurons for cluster 1, 2 and 3 respectively. For statistical details, see table S1.
Fig. 7.
Fig. 7.. Manipulating oxytocinergic activity affects the behavioral reactions towards unresponsive peers.
(A) Schematic optogenetic inhibition of PVH oxytocin neurons bilaterally expressing eNpHR3.0. (B) Plots of behavioral epochs of six female subjects presented with unresponsive female partners in light-off (upper) and light-on (lower) conditions. Blue, sniffing; beige, grooming; red, mouth/eye interaction. (C) Cumulative durations of total interactions. Paired t test, **P < 0.01, n = 6 animals. (D) Cumulative durations of sniffing, grooming, and mouth/eye interaction in light-off vs. light-on conditions. Two-way RM ANOVA with Bonferroni’s multiple comparisons test, ns, not significant, **P < 0.01, n = 6 animals. (E) Schematic optogenetic activation of PVH oxytocin neurons expressing ChR2. (F) Plots for eight female subjects presented with unresponsive female strangers in light-off (upper) and light-on (lower) conditions. Blue, sniffing; beige, grooming; red, mouth/eye interaction. (G to H) Similar to (C to D) but for optogenetic activation. Paired t test in (G) and Two-way RM ANOVA with Bonferroni’s multiple comparisons test in (H), ns, not significant, **P < 0.01, *P < 0.05, n = 8 animals. (I) Schematic injection of an oxytocin receptor antagonist in the lateral ventricle. (J) Plots of behavioral epochs in five female subjects presented with unresponsive female partners after injection of ACSF vehicle (upper) or oxytocin receptor antagonist (lower). Blue, sniffing; beige, grooming; red, mouth/eye interaction. (K to L) Cumulative durations of total interactions and different types of actions. Paired t test in (K) and Two-way RM ANOVA with Bonferroni’s multiple comparisons test in (L), **P < 0.01, ****P < 0.0001, n = 5 animals. For statistical details, see table S1.

Comment in

  • An innate drive to save a life.
    Sheeran WM, Donaldson ZR. Sheeran WM, et al. Science. 2025 Feb 21;387(6736):827-828. doi: 10.1126/science.adv3731. Epub 2025 Feb 20. Science. 2025. PMID: 39977520

References

    1. Bartal IB-A, Decety J, Mason P, Empathy and Pro-Social Behavior in Rats. Science 334, 1427–1430 (2011). - PMC - PubMed
    1. Burkett JP, Andari E, Johnson ZV, Johnson Z, Curry DC, de Waal FBM, Young LJ, Oxytocin-dependent consolation behavior in rodents. Science 351, 375–378 (2016). - PMC - PubMed
    1. Wu YE, Dang J, Kingsbury L, Zhang M, Sun F, Hu RK, Hong W, Neural control of affiliative touch in prosocial interaction. Nature 599, 262–267 (2021). - PMC - PubMed
    1. Borie AM, Young LJ, Liu RC, Sex-specific and social experience-dependent oxytocin-endocannabinoid interactions in the nucleus accumbens: implications for social behaviour. Philos Trans R Soc Lond B Biol Sci 377, 20210057 (2022). - PMC - PubMed
    1. De Marco A, Cozzolino R, Thierry B, Coping with mortality: responses of monkeys and great apes to collapsed, inanimate and dead conspecifics. Ethology Ecology & Evolution 34, 1–50 (2022).

LinkOut - more resources