

Synergy of genetics and lipid metabolism driving feed utilization efficiency in chickens
- PMID: 39978204
- PMCID: PMC11880708
- DOI: 10.1016/j.psj.2025.104885
Synergy of genetics and lipid metabolism driving feed utilization efficiency in chickens
Abstract
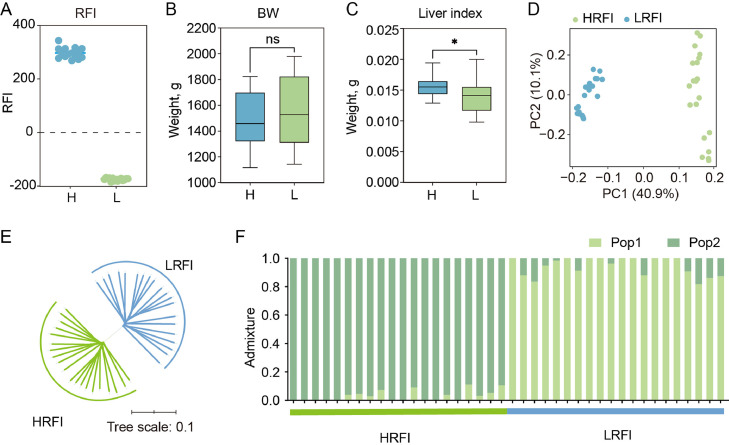
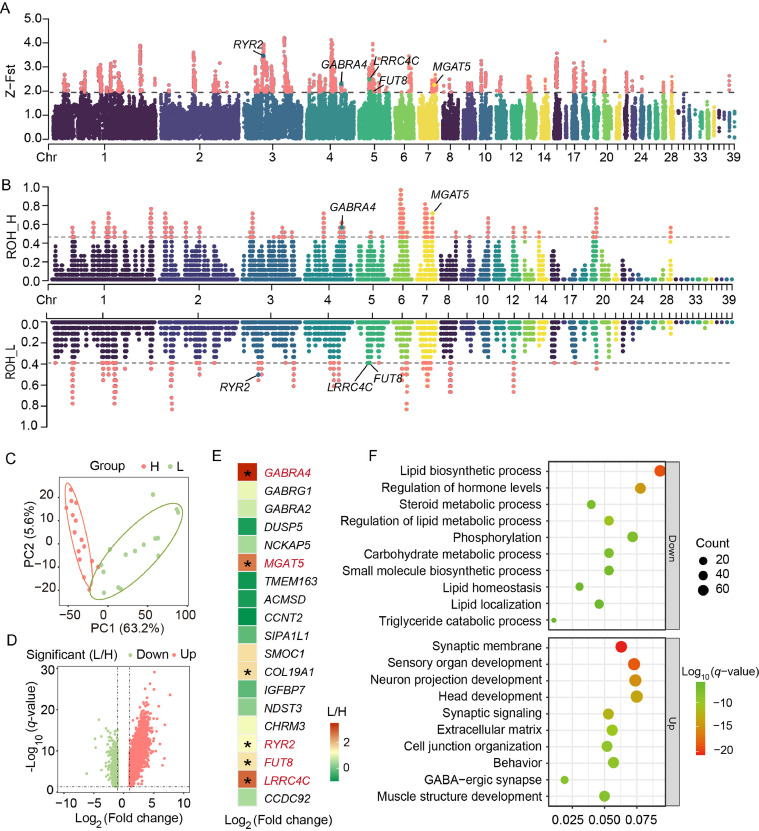
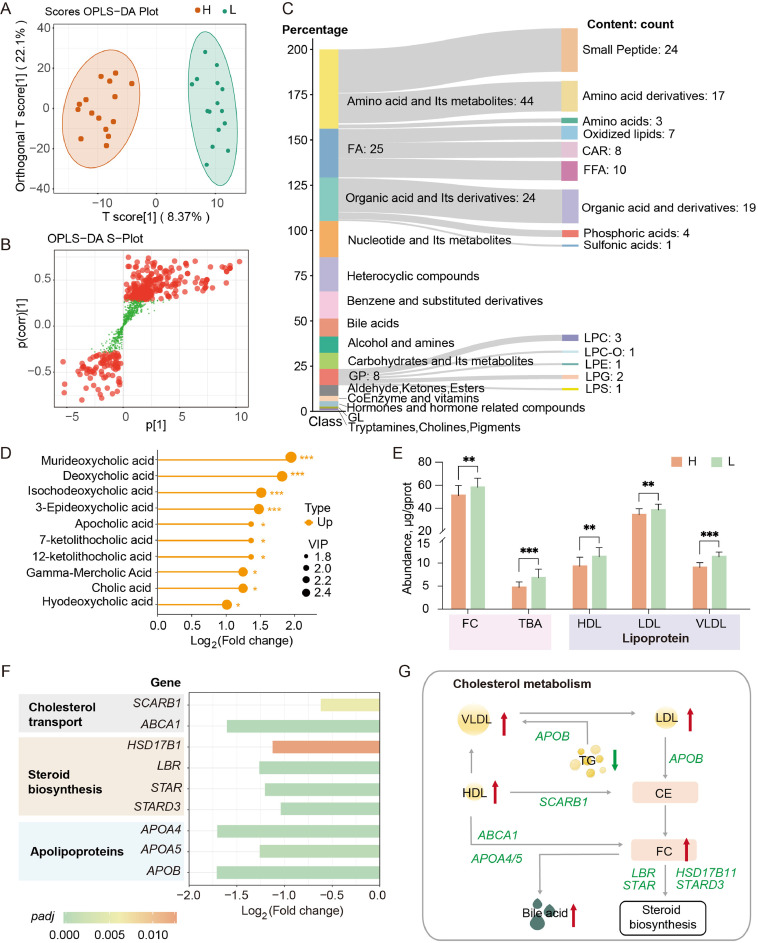
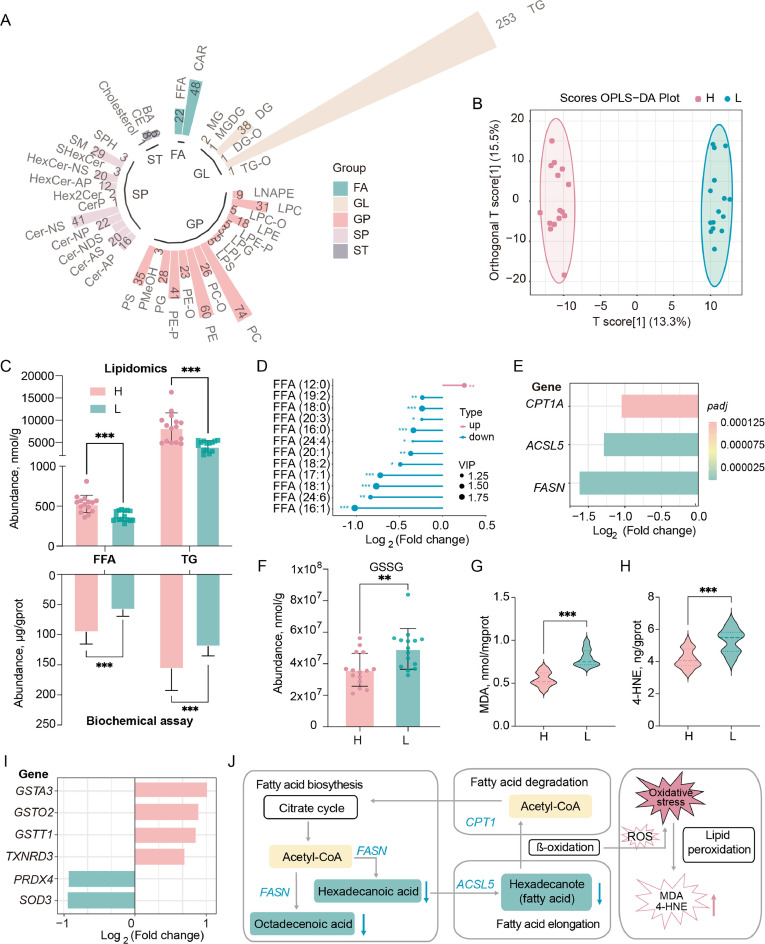
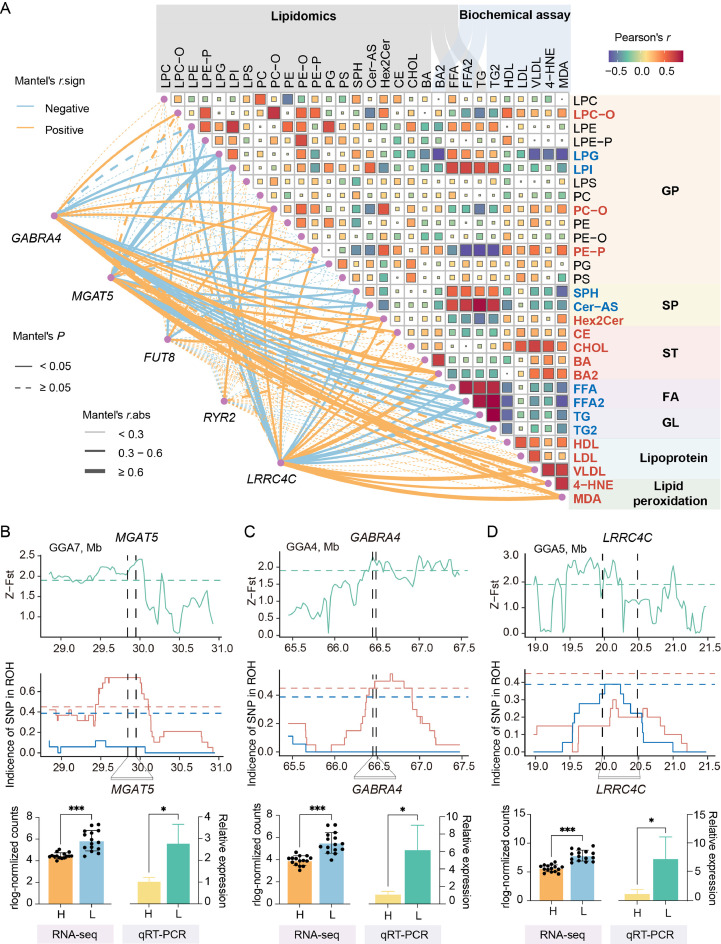
Residual feed intake (RFI) is a key indicator of feed efficiency, critical for enhancing the economic sustainability of poultry production. However, the genetic and metabolic regulatory mechanisms of RFI remain unclear. This study analyzed the genome, liver transcriptome, metabolome, and lipidome of hens with low and high feed efficiency (N = 60) from the previously established RFI divergent broiler lines (F15). Our results revealed pronounced genetic differentiation between low RFI (LRFI) and high RFI (HRFI) lines and identified genomic signatures of selection associated with feed efficiency. Transcriptomic analysis showed differential expression of genes involved in neural regulation and lipid metabolism. Notably, LRFI chickens exhibited reduced hepatic lipid accumulation, which was associated with decreased fatty acid metabolism and increased cholesterol metabolism (P < 0.05). The lipidomic analysis uncovered distinct profiles of glycerophospholipids (e.g., PE-P and PC-O) and sphingolipids (e.g., ceramides), which were more abundant in LRFI chickens (P < 0.05) and strongly correlated with key lipid metabolism processes (P < 0.05). Despite improved feed efficiency, LRFI chickens demonstrated signs of increased oxidative stress. Moreover, integrative analyses revealed that genes such as MGAT5, GABRA4, and LRRC4C, exhibiting strong selection signatures and higher expression in the LRFI line (P < 0.05), were identified as key regulators of lipid metabolism, potentially contributing to the observed differences in feed efficiency. This comprehensive study highlights the synergistic effect of genetics and lipid metabolism in driving feed utilization efficiency in chickens, establishing a scientific foundation for breeding strategies aimed at improving feed efficiency in poultry production.
Keywords: Chicken; Genetics; Lipid metabolism; Multiomics; RFI.
Copyright © 2025. Published by Elsevier Inc.
Conflict of interest statement
Declaration of competing interest The authors declare no competing interests.
Figures
Similar articles
-
Transplantation of fecal microbiota from low to high residual feed intake chickens: Impacts on RFI, microbial community and metabolites profiles.Poult Sci. 2025 Jan;104(1):104567. doi: 10.1016/j.psj.2024.104567. Epub 2024 Nov 23. Poult Sci. 2025. PMID: 39603188 Free PMC article.
-
Effect of divergence in residual feed intake on expression of lipid metabolism-related genes in the liver of meat-type ducks1.J Anim Sci. 2019 Sep 3;97(9):3947-3957. doi: 10.1093/jas/skz241. J Anim Sci. 2019. PMID: 31325379 Free PMC article.
-
Long-term divergent selection for residual feed intake in Chinese broiler chickens.Poult Sci. 2023 Mar;102(3):102298. doi: 10.1016/j.psj.2022.102298. Epub 2022 Oct 29. Poult Sci. 2023. PMID: 36638759 Free PMC article.
-
Transcriptomic analysis to elucidate the molecular mechanisms that underlie feed efficiency in meat-type chickens.Mol Genet Genomics. 2015 Oct;290(5):1673-82. doi: 10.1007/s00438-015-1025-7. Epub 2015 Mar 18. Mol Genet Genomics. 2015. PMID: 25782841
-
Review: divergent selection for residual feed intake in the growing pig.Animal. 2017 Sep;11(9):1427-1439. doi: 10.1017/S175173111600286X. Epub 2017 Jan 25. Animal. 2017. PMID: 28118862 Free PMC article. Review.
Cited by
-
Residual feed intake in late-laying hens: immune function, metabolic efficiency, and feed utilization dynamics.Front Vet Sci. 2025 Jul 7;12:1624978. doi: 10.3389/fvets.2025.1624978. eCollection 2025. Front Vet Sci. 2025. PMID: 40693113 Free PMC article.
-
Effects of central injection of liver-expressed antimicrobial peptide-2 (LEAP2) on feed intake in broiler chickens: interactions with opioidergic and serotonergic systems.Vet Res Commun. 2025 Jun 21;49(4):234. doi: 10.1007/s11259-025-10798-6. Vet Res Commun. 2025. PMID: 40542992
References
-
- Alexandre P.A., Kogelman L.J., Santana M.H., Passarelli D., Pulz L.H., Fantinato-Neto P., Silva P.L., Leme P.R., Strefezzi R.F., Coutinho L.L., Ferraz J.B., Eler J.P., Kadarmideen H.N., Fukumasu H. Liver transcriptomic networks reveal main biological processes associated with feed efficiency in beef cattle. BMC Genom. 2015;16:1073. - PMC - PubMed
MeSH terms
LinkOut - more resources
Full Text Sources
Miscellaneous
