

Infant attention and frontal EEG neuromarkers of childhood ADHD
- PMID: 39978291
- PMCID: PMC11889623
- DOI: 10.1016/j.dcn.2025.101524
Infant attention and frontal EEG neuromarkers of childhood ADHD
Abstract
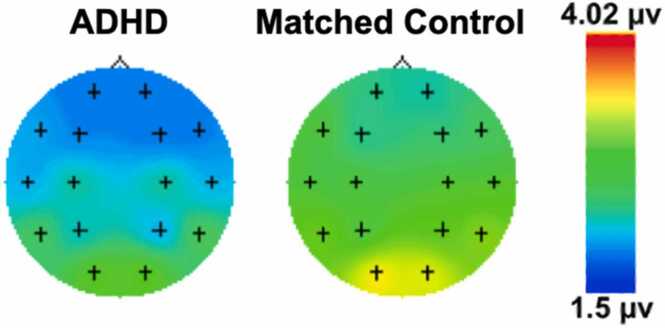
Numerous electroencephalogram (EEG) studies have sought to elucidate the neural mechanisms of attention deficit hyperactivity disorder (ADHD), with most of the existing literature focused on children, adolescents, and adults. In this retrospective study, measures of frontal EEG power and behavioral attention of 40 5-month-old infants later diagnosed with ADHD in childhood were compared to 40 systematically matched-control infants. Compared to the control group, infants in the ADHD group exhibited longer looking fixations during an attention task. Frontal EEG power in the 6-9 Hz infant alpha band was lower in the ADHD group compared to the control group. Mean frontal EEG power was associated with visual fixations, underscoring specific attention behavior corresponding to frontal brain development in infancy. Infants later diagnosed with ADHD exhibited higher attention problems in childhood at ages 4 and 9 compared to the control group, and longer looking fixations in infancy were associated with higher childhood ADHD-related symptomatology. These findings suggest that decreased infant frontal EEG power and looking fixations as early as 5-months of age may serve as important early markers of later ADHD and can aid in building a more comprehensive model of ADHD from a developmental neuroscience approach.
Keywords: ADHD; Attention; Childhood; EEG; Frontal lobe; Infancy.
Copyright © 2025 The Authors. Published by Elsevier Ltd.. All rights reserved.
Conflict of interest statement
Declaration of Competing Interest The authors declare that they have no known competing financial interests or personal relationships that could have appeared to influence the work reported in this paper.
Figures


References
-
- Achenbach, T.M., 2001. Manual for ASEBA school-age forms & profiles. University of Vermont, Research Center for Children, Youth & Families..
-
- Bell, M.A. (1998). Frontal lobe function during infancy: Implications for the development of cognition and attention.
-
- Bellato A., Norman L., Idrees I., Ogawa C.Y., Waitt A., Zuccolo P.F.…Shephard E. A systematic review and meta-analysis of altered electrophysiological markers of performance monitoring in Obsessive-Compulsive Disorder (OCD), Gilles de la Tourette Syndrome (GTS), Attention-Deficit/Hyperactivity disorder (ADHD) and Autism. Neurosci. Biobehav. Rev. 2021;131:964–987. doi: 10.1016/j.neubiorev.2021.10.018. - DOI - PubMed
Publication types
MeSH terms
Grants and funding
LinkOut - more resources
Full Text Sources
Medical
