. 2025 Feb 20;13(2):e010472.
doi: 10.1136/jitc-2024-010472.

Ethanol inhibits the growth and metastasis of hepatocellular carcinoma by inducing immunogenic cell death

Affiliations

Ethanol inhibits the growth and metastasis of hepatocellular carcinoma by inducing immunogenic cell death

Yu-Chen Hsu et al. J Immunother Cancer. .

Abstract

Background: Immunogenic cell death (ICD) can elicit an adaptive immune response with significant antitumor effects. Percutaneous ethanol injection therapy has been applied as tumor ablation for small hepatocellular carcinoma (HCC). However, it was not clear whether ethanol can elicit ICD. The aim of this study is to investigate the role of ethanol as an ICD inducer.

Methods: HCC cell lines were treated with low-concentration ethanol and ICD markers, such as calreticulin, high-mobility group box 1, and ATP were assayed. The mouse vaccination-rechallenge assay was used to further confirm ethanol as an ICD inducer. Western blot and real-time PCR were used to investigate ICD-related endoplasmic reticulum (ER) stress and signaling pathways. The genes with differential expression levels between primary and distant tumors were analyzed by nCounter gene expression. Intratumoral injection of ethanol was done to investigate the abscopal effect.

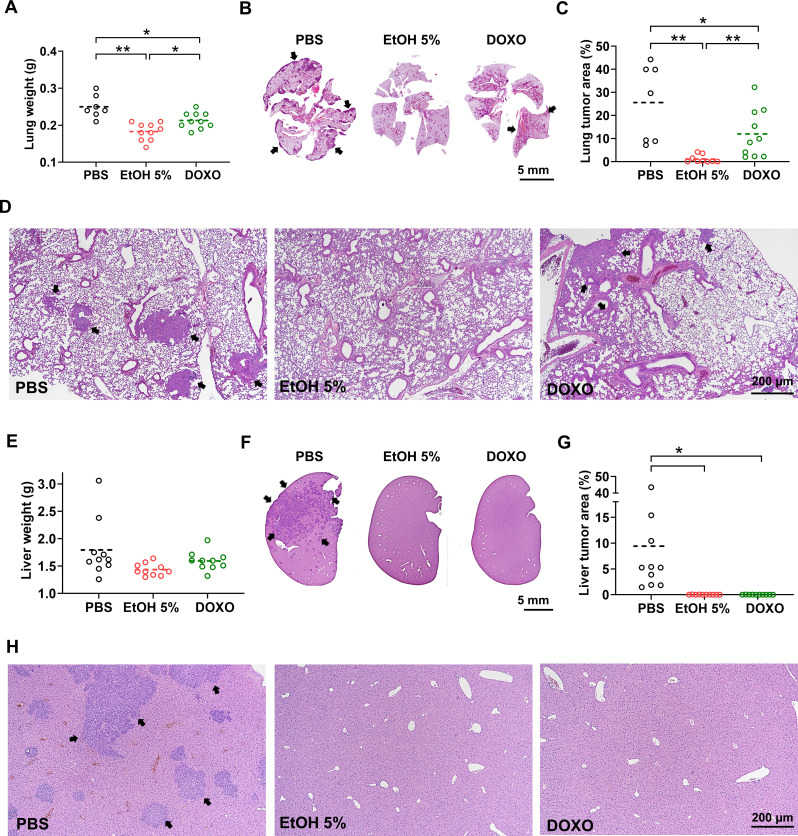
Results: The low-concentration ethanol could induce ICD in HCC cell lines through unfolded protein responses initiated by ER stress and multiple cell-death pathways. Intratumoral injections of low-concentration ethanol had significantly direct and abscopal antitumor effects in mouse models of both subcutaneous and orthotopic HCC. nCounter gene expression analysis in primary and distant tumors revealed the activation of various immune-response pathways, notably those mediated by CD8 T cells and the interferon pathway. Vaccinating mice with low-concentration ethanol-treated HCC cells successfully inhibited metastasis in both intravenous and intrasplenic metastasis models.

Conclusions: Our results suggest that low-concentration ethanol could serve as an inducer of ICD. Low-concentration ethanol could potentially improve therapeutic antitumor immunity by inducing substantial ICD.

Keywords: Abscopal; Hepatocellular Carcinoma; Immunotherapy.


Conflict of interest statement

Competing interests: No, there are no competing interests.

Figures

Figure 1
Figure 1. Low-concentration ethanol-induced ICD in HCC cell lines in vitro and in vivo vaccination-rechallenge assay. In vitro assay, (A) Ratio of membrane-exposed calreticulin (CRT+) cells, mean fluorescence intensity, and histogram of membrane-exposed calreticulin in mouse and (B) human HCC cell lines after 6 hours of titrated ethanol treatment. (C) ATP release in culture media at 12 hours and (D) HMGB1 levels in culture medium at 48 hours post-treatment, analyzed by Western blotting (Ponceau S staining on PVDF as control). In vivo vaccination-rechallenge assay: ethanol-treated Hep-55.1C cells were injected subcutaneously into one flank of C57BL/6 mice as a tumor vaccine, with untreated Hep-55.1C cells on the opposite flank. (E) Tumor-free mouse percentage and (F) tumor volume post-challenge. (G) Long-term memory in mice vaccinated with 5% ethanol-treated cells, rechallenged with Hep-55.1C or B16F1 cells. Sample sizes ranged from 4 to 6 per group. Data are presented as mean±SD. *p<0.05, **p<0.01, ***p<0.001 versus control group (EtOH 0%). DOXO, doxorubicin; EtOH, ethanol; FITC, fluorescein isothiocyanate; HCC, hepatocellular carcinoma; HMGB1, high-mobility group box 1; ICD, immunogenic cell death; MFI, mean fluorescence intensity; PBS, phosphate-buffered saline; PVDF, polyvinylidene difluoride membrane.
Figure 2
Figure 2. Induction of ICD by low-concentration ethanol via split unfolded protein response and ER stress-associated cell death pathways. (A) Immunoblot analysis of phosphorylated eIF2α (p-eIF2α) and total eIF2α in Hep-55.1C cells treated with ethanol at various concentrations for 6 hours. (B) Time-course analysis of p-eIF2α and total eIF2α expression in Hep-55.1C cells following treatment with 5% ethanol. (C) Expression levels of ATF4 and CHOP proteins after 24 hours of treatment with graded ethanol concentrations were detected by immunoblot. (D) Real-time PCR quantification of unspliced XBP1 (uXBP1) and spliced XBP1 (sXBP1) mRNA to assess IRE1 activation after 4 hours of ethanol treatment at different concentrations. (E) Western blot analysis of HMGB1 release in the medium after 12 hours of 5% ethanol treatment with inhibitors targeting apoptosis (Z-VAD-FMK), necroptosis (Necrostatin-1), ferroptosis (Ferrostatin-1), pyroptosis (Ac-FLTD-CMK), and autophagy (Chloroquine). Vinculin or GAPDH served as loading controls, and Ponceau S staining on PVDF membranes was used as an additional control specifically for medium HMGB1 detection. Each experimental group consisted of three biological replicates. Data are presented as mean±SD. *p<0.05, **p<0.01, ***p<0.001 versus control group (EtOH 0%). ER, endoplasmic reticulum; EtOH, ethanol; HMGB1, high-mobility group box 1; ICD, immunogenic cell death; mRNA, messenger RNA; PVDF, polyvinylidene difluoride membrane.
Figure 3
Figure 3. Inducing ICD in HCC in vivo with intratumoral low-concentration ethanol injections shows antitumor effects on primary and distant tumors. (A) Microscopy images showing HMGB1 translocation from the nucleus to the cytoplasm in tumor cells and (B) confocal images illustrating the translocation of calreticulin (CRT) to the plasma membrane, captured at 6 hours after intratumoral administration of varying concentrations of ethanol or doxorubicin (positive control). Serum levels of HMGB1 (C) and ATP (D) at 6 and 12 hours in mice treated with titrated concentration ethanol or doxorubicin compared with saline-treated mice. Sample sizes ranged from 4 to 6 per group. (E) HCC cells were implanted bilaterally, with the primary tumor receiving intratumoral injections of titrated concentrations of ethanol, normal saline (NS), or doxorubicin. The size of the distant tumor was also monitored to evaluate the abscopal effect and assess systemic anticancer immunity. (F) In a parallel setup, the primary tumor received ethanol combined with anti-PD1 (1.25% + α-PD1) to assess the combined systemic anticancer immunity. The number of mice analyzed is indicated in parentheses. Data are presented as mean±SD. *p<0.05, **p<0.01 versus control group (EtOH 0% or normal saline group for tumor size measurement). DOXO, doxorubicin; EtOH, ethanol; HCC, hepatocellular carcinoma; HMGB1, high-mobility group box 1; ICD, immunogenic cell death; IT, intratumoral; PD1, programmed cell death protein-1.
Figure 4
Figure 4. Immune cell infiltration and responses in primary and distant tumors after repeated intratumoral injections of low-concentration ethanol. (A, B) Heatmaps display the mean cell type scores of various immune cells in primary and distant tumors treated with 1.25% ethanol (EtOH) or saline (NS), while truncated violin plots display the distribution and median of these scores. These scores are calculated from the mean log2 expression levels of all probes and analyzed using nCounter’s Cell Type Profiling Capabilities. (C) A heatmap shows Gene Set Analysis Significance Scores for primary versus distant tumors in the EtOH and NS groups, derived from the mean log2 expression levels using nCounter’s gene set analysis. (D) Volcano plots illustrate differentially expressed genes between the EtOH and NS control groups. Red points indicate genes with adjusted p values<0.05 and absolute log2 fold changes>0.5. Dark gray points represent genes from the associated gene set, while light gray points encompass all genes analyzed with nCounter probes for the 770 genes predefined by the PanCancer Immune Profiling Panel. (E) The GSEA plot highlights the most enriched pathways from WikiPathways and Reactome, analyzing differences between the EtOH and NS control groups. Normalized Enrichment Score (NES) is noted. Each group consists of three samples. DC, dendritic cell; GSEA, Gene Set Enrichment Analysis; NK, natural killer; TIL, tumor-infiltrating lymphocyte; Treg, regulatory T cell.
Figure 5
Figure 5. Impact of repeated intratumoral low-concentration ethanol administration on orthotopic HCC tumor growth and metastasis. (A) HCC cells were implanted into the liver and one side of the subcutaneous flank area of mice. Tumor sizes were monitored over time after orthotopic tumors received intratumoral injections (IT) of varying concentrations of ethanol, normal saline (NS), or doxorubicin (positive control). (B–C) Evaluation of lung weight, number of metastatic colonies in lung sections, and histological analysis of lung tissue using H&E staining at the conclusion of the experiment. Arrows indicated the presence of metastatic HCC tumor. The number of mice analyzed is indicated in parentheses. Statistical significance is indicated as *p<0.05, **p<0.01 versus the control group (NS). DOXO, doxorubicin; EtOH, ethanol; HCC, hepatocellular carcinoma; SC, subcutaneous.
Figure 6
Figure 6. Abscopal effects of repeated intratumoral administration of low-concentration ethanol on HCC in diverse organs. (A) Mice were implanted with HCC cells in both the liver and subcutaneous flank areas. Both types of tumors were tracked following injections into the subcutaneous tumors with varying concentrations of ethanol, saline (NS), or doxorubicin (used as a control). (B–C) The experiment concluded with measurements of lung weight, counting of metastatic colonies in lung tissue sections, and histological evaluations of the lung. Arrows indicated the presence of metastatic HCC tumor. The number of mice analyzed is indicated in parentheses. Data are presented as mean±SD. *p<0.05, **p<0.01 versus the control group (NS). DOXO, doxorubicin; EtOH, ethanol; HCC, hepatocellular carcinoma; IT, intratumoral; SC, subcutaneous.
Figure 7
Figure 7. Antimetastatic effects of vaccination with low-concentration ethanol-treated tumor cells in intravenous and intrasplenic metastasis models. (A–D) Lung weight, whole-section scans, relative metastatic tumor area percentages in the lung, and histological analysis of lung tissue using H&E staining were compared in the intravenous metastasis models. (E–H) Liver weight, whole-section scans of the left liver lobe, relative metastatic tumor area percentages in the liver, and histological analysis of liver tissue using H&E staining were compared in the intrasplenic metastasis models. Arrows indicated the presence of metastatic HCC tumor colonies. Results for mice vaccinated with 5% ethanol-treated Hep-55.1C cells (EtOH 5%), doxorubicin (DOXO, used as a positive control), and PBS (used as a negative control) are presented. Each dot represents an individual mouse. Statistical significance is indicated as *p<0.05, **p<0.01 versus the control group (NS). EtOH, ethanol; HCC, hepatocellular carcinoma; PBS, phosphate-buffered saline.

References

    1. Sung H, Ferlay J, Siegel RL, et al. Global Cancer Statistics 2020: GLOBOCAN Estimates of Incidence and Mortality Worldwide for 36 Cancers in 185 Countries. CA Cancer J Clin. 2021;71:209–49. doi: 10.3322/caac.21660. - DOI - PubMed
    1. Singal AG, Llovet JM, Yarchoan M, et al. AASLD Practice Guidance on prevention, diagnosis, and treatment of hepatocellular carcinoma. Hepatology. 2023;78:1922–65. doi: 10.1097/HEP.0000000000000466. - DOI - PMC - PubMed
    1. Hasegawa K, Takemura N, Yamashita T, et al. Clinical Practice Guidelines for Hepatocellular Carcinoma: The Japan Society of Hepatology 2021 version (5th JSH-HCC Guidelines) Hepatol Res. 2023;53:383–90. doi: 10.1111/hepr.13892. - DOI - PubMed
    1. Reig M, Forner A, Rimola J, et al. BCLC strategy for prognosis prediction and treatment recommendation: The 2022 update. J Hepatol. 2022;76:681–93. doi: 10.1016/j.jhep.2021.11.018. - DOI - PMC - PubMed
    1. Vogel A, Martinelli E, et al. ESMO Guidelines Committee Updated treatment recommendations for hepatocellular carcinoma (HCC) from the ESMO Clinical Practice Guidelines. Ann Oncol. 2021;32:801–5. doi: 10.1016/j.annonc.2021.02.014. - DOI - PubMed

MeSH terms