. 2025 Feb 20;16(1):1803.
doi: 10.1038/s41467-025-56927-2.

Zika virus NS1 drives tunneling nanotube formation for mitochondrial transfer and stealth transmission in trophoblasts

Affiliations

Zika virus NS1 drives tunneling nanotube formation for mitochondrial transfer and stealth transmission in trophoblasts

Rafael T Michita et al. Nat Commun. .

Abstract

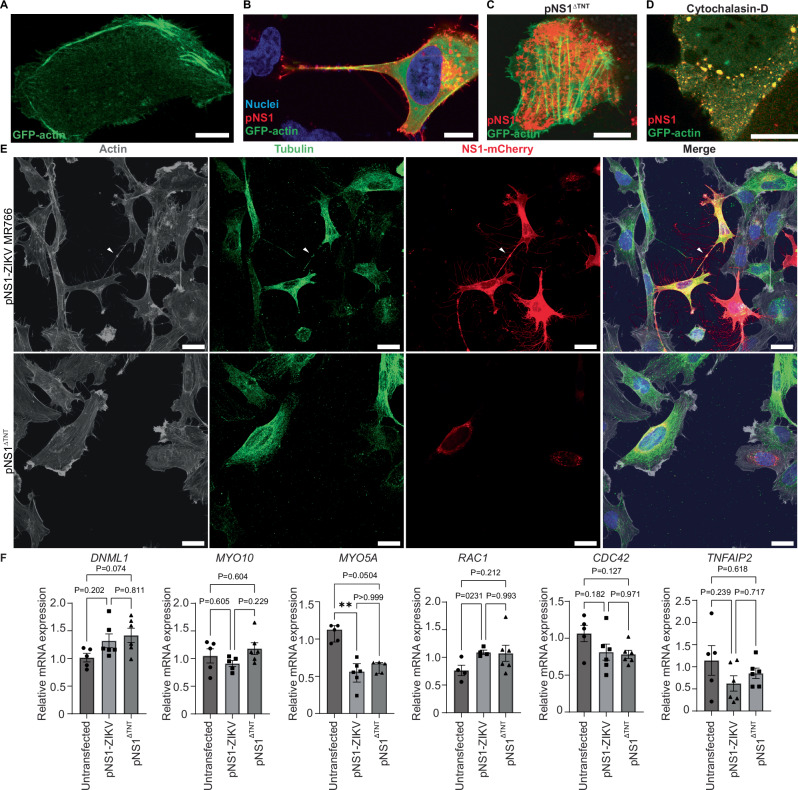
Zika virus (ZIKV) is unique among orthoflaviviruses in its vertical transmission capacity in humans, yet the underlying mechanisms remain incompletely understood. Here, we show that ZIKV induces tunneling nanotubes (TNTs) in placental trophoblasts which facilitate transfer of viral particles, proteins, mitochondria, and RNA to neighboring uninfected cells. TNT formation is driven exclusively via ZIKV non-structural protein 1 (NS1). Specifically, the N-terminal 1-50 amino acids of membrane-bound ZIKV NS1 are necessary for triggering TNT formation in host cells. Trophoblasts infected with TNT-deficient ZIKVΔTNT mutant virus elicited a robust antiviral IFN-λ 1/2/3 response relative to WT ZIKV, suggesting TNT-mediated trafficking allows ZIKV cell-to-cell transmission camouflaged from host defenses. Using affinity purification-mass spectrometry of cells expressing wild-type NS1 or non-TNT forming NS1, we found mitochondrial proteins are dominant NS1-interacting partners. We demonstrate that ZIKV infection or NS1 expression induces elevated mitochondria levels in trophoblasts and that mitochondria are siphoned via TNTs from healthy to ZIKV-infected cells. Together our findings identify a stealth mechanism that ZIKV employs for intercellular spread among placental trophoblasts, evasion of antiviral interferon response, and the hijacking of mitochondria to augment its propagation and survival and offers a basis for novel therapeutic developments targeting these interactions to limit ZIKV dissemination.


Conflict of interest statement

Competing interests: I.U.M. serves on the scientific advisory board of Seed Health. The remaining authors declare no competing interests.

Figures

Fig. 1
Fig. 1. Multiple ZIKV strains induce TNT formation in human placental trophoblast cells and transfer viral proteins.
A Schematic of fluorescent mCherry-tagged ZIKV MR-766 for live-cell imaging of tunneling nanotubes (TNTs). B ZIKV MR-766 and PRVABC-59 strains induce thin and long TNTs (arrows) connecting infected cells 24 hours post infection (hpi) in HTR-8 cells and JEG-3 (both MOI = 0.1), and primary human trophoblast cells (PHTs, MOI = 3) isolated from term placenta. Merged images show nuclei (blue), actin (gray), and ZIKV-mCherry or ZIKV-NS1 (red). C ZIKV MR-766 (MOI = 1, 24 hpi) infection of A549 cells induces TNT formation showing colocalization of virus envelope (E, green) and capsid (red) proteins within TNT, nuclei is stained in blue. D Live-cell imaging of A549 cells, 48 hours post transfection, show viral RNA and virus replicon (green) within TNTs and neighboring cells. Schematics showing the construction of ZIKV MR-766 fluorescent-tagged viral replicon plasmid. Open reading frames (ORFs) for structural proteins in ZIKV cDNA were replaced with an ORF coding for fluorescent mEmerald protein by site directed mutagenesis and overlap PCR cloning. E ZIKV-induced TNTs in HTR-8 cells transfer dsRNA between connected cells. Merged figure shows ZIKV-NS1 (red), dsRNA (green), nuclei (blue) and actin (gray). BE Show representative confocal images from experiments repeated independently 3× with similar results. Images were acquired by confocal microscopy at 60X oil objectives lens at 1.4 normal aperture (NA) (B) and at 40x (E) using a Nikon A1R. Images were processed using the NIS Elements software (Nikon). Bar = 25 μm.
Fig. 2
Fig. 2. The non-structural protein 1 (NS1) of ZIKV is unique and necessary for inducing TNT formation in multiple cell types.
A TNT induction by individual mCherry-tagged ZIKV proteins in A549 cells as indicated by the % number of cells with TNTs (n = 3). BO TNT formation by expression of mCherry-tagged NS1 proteins of orthoflaviviruses Zika virus (ZIKV) MR-766 and PRVABC-59, dengue virus (DENV) 1-4, deer tick virus (DTV), West Nile virus (WNV), and Japanese encephalitis virus (JEV). B Number of TNTs per cell in A549 and C the corresponding normalized fluorescence (NF) intensity of NS1 expression, n = 5. D Number of TNTs per cell in HTR-8 and E the corresponding NF intensity of NS1 expression, n = 5. Representative confocal images of independent experiments showing control F untransfected HTR-8 cells and G, H cells transfected with NS1 proteins from ZIKV MR-766 and PRVABC-59, n = 3. IO Representative image of independent experiments (n = 5) showing TNT induction of NS1 orthoflaviviruses. Merged figures show nuclei (blue), actin (gray), and orthoflavivirus NS1 proteins (red). P Number of TNTs per ZIKV-MR766 NS1-expressing cells (n = 10) and Q the average length of individual TNTs (A549, n = 50; U-87 MG, n = 57; SH-SY5Y, n = 36; HTR-8, n = 50; JEG-3, n = 32, BeWo, n = 20; Vero E6, n = 3). Images were acquired using Nikon A1R (60X oil objectives lens at 1.4 normal aperture (NA) at 48 hours post transfection. The confocal images shown are representative of experiments independently repeated with similar results. Data is presented as mean ± SEM. Statistical significance was determined by ANOVA followed by Dunnett’s (P) or Tukey’s (Q) multiple comparison tests, *= P ≤ 0.05, **= P ≤ 0.01, and ****= P ≤ 0.0001. Bar = 25 μm. Source data are provided as a Source Data file.
Fig. 3
Fig. 3. The N-terminus of ZIKV-NS1 is necessary to induce TNT formation.
A Schematics depicting of the plasmid constructs generated in which ZIKV-NS1 sequence was replaced with the sequences from dengue virus (DENV)-2 NS1 (top panel). Clustal Omega multiple sequence alignment of N-terminal NS1 from DENV2, ZIKV, West Nile virus (WNV), and deer tick virus (DTV) (bottom panel). B Structure of ZIKV-NS1 dimer (PDB:4O6B), with the N-terminal 50 amino acids of each monomer colored in blue and red for chains (A) (teal) and (B) (pink), respectively. C Structure of N-terminal 50 amino acids of NS1 dimer. Images in B and C were generated using UCSF Chimera. D Growth curves of ZIKV MR-766 and ZIKVΔTNT in VeroE6, JEG-3, and HTR-8 cells determined by fluorescence dilution assay (MOI = 0.1) at 24 hrs (hours) (JEG-3 n = 5, others n = 6), and at 48-, 72-, and 96-hours post-infection (n = 6 for all timepoints) expressed as focus-forming units (FFU)/mL. E Representative confocal imaging of HTR-8 cells 24 hrs after infection with ZIKVΔTNT (MOI = 0.1) or (F) expressing pNS1ΔTNT showing absence of TNTs. G Schematics for purification of secreted ZIKV-NS1. H Representative image of HTR-8 cells treated with secreted NS1 for 48 hrs showing NS1 in endosomal-like compartments, and no TNT formation. Merged figures show actin (gray), nuclei (blue), and ZIKVΔTNT/pNS1ΔTNT/NS1 secreted (red). The confocal images shown are representative of experiments (n = 3) independently repeated with similar results. Images were acquired by confocal microscopy at 60X oil objectives lens at 1.4 normal aperture (NA) and at 40X (M) using a Nikon A1R. Images were processed using the NIS Elements software (Nikon). Bar = 25 µm. Source data are provided as a Source Data file.
Fig. 4
Fig. 4. ZIKV NS1 colocalization with cytoskeletal components and regulation of TNT-related genes.
A A549 cells expressing pGFP-actin show typical cytoskeletal actin distribution, including stress fibers. B Expression of pNS1-ZIKV and pGFP-actin show remodeling of the actin cytoskeleton and the formation of TNT-like structures connecting neighboring cells. C Cells expressing pGFP-actin and pNS1ΔTNT do not induce actin remodeling and TNT formation. D Cells co-expressing pGFP-actin and pNS1-ZIKV treated with cytochalasin-D (100 nM, 30 mins) lack TNT formation. Merged figures show actin (green), pNS1 (red) and nuclei (blue). E pNS1-ZIKV-induced TNTs in HTR-8 cells associates with the cell membrane and is composed by both tubulin and F-actin, while pNS1ΔTNT is unable to form TNTs 24 hours post transfection (hpt). Merged figures show actin (gray), tubulin (green), and ZIKV-NS1 (red). F HTR-8 gene expression levels, at 24hpt, of DNML1 [untransfected=5, pNS1-ZIKV (n = 6), pNS1ΔTNT (n = 6)], MYO10 [untransfected=5, pNS1-ZIKV (n = 5), pNS1ΔTNT (n = 6)], MYO5A [untransfected=5, pNS1-ZIKV (n = 6), pNS1ΔTNT (n = 5)], RAC1 [untransfected=4, pNS1-ZIKV (n = 4), pNS1ΔTNT (n = 6)], CDC42 [untransfected=5, pNS1-ZIKV (n = 6), pNS1ΔTNT (n = 6)], and TNFAIP2 [untransfected=5, pNS1-ZIKV (n = 6), pNS1ΔTNT (n = 6)]. Statistically significant outliers identified by Grubb’s tests were excluded in MYO5A (untransfected, n = 1; pNS1ΔTNT, n = 1) and RAC1 (untransfected, n = 1; pNS1-ZIKV, n = 1) comparisons. Values are represented as mean ± SEM or median and interquartile range (MYO5A). Statistical significance was determined by one-way ANOVA (DNML1, MYO10, RAC1, CDC42, and TNFAIP2) and Kruskal-Wallis (MYO5A) followed by Tukey’s and Dunn’s multiple comparisons tests. The confocal images shown are representative of experiments (n = 3) independently repeated with similar results. Images were acquired by confocal microscopy at 60X (AD) oil objectives lens at 1.4 normal aperture (NA) and at 40X (E) using a Nikon A1R. Images were processed using the NIS Elements software (Nikon). Bar = 10 µm (AD) and 25 μm (E). **= P ≤ 0.01. Source data are provided as a Source Data file.
Fig. 5
Fig. 5. NS1-induced TNTs are associated with mitochondrial proteins.
AD Affinity Purification Mass spectrometry analysis of ZIKV NS1 interacting proteins associated with TNT formation in JEG-3 cells. A Venn diagram showing pNS1-ZIKV and pNS1ΔTNT (non-TNT forming) interacting partners [2-fold difference; P ≤ 0.05 (uncorrected)]. B Subcellular location of 178 proteins enriched with wild-type TNT forming ZIKV NS1. C unique interacting partners of wild-type TNT forming ZIKV NS1 (n = 50) according to the Uniprot database (https://www.uniprot.org/ accessed on 09/29/2023 at 2:28 pm). D Heatmap showing differential protein-protein interactions with TNT forming NS1 and mutant NS1ΔTNT, n = 3. E Representative confocal imaging showing colocalization of ZIKV-NS1 and mitochondria in HTR-8 trophoblast cells at 16 hours post-transfection (hpt) and co-culture. ROI is magnified as insets and shown as single channels. Merged images show F-actin (gray), mitochondria (green), and ZIKV-NS1 (red). FI Mitochondria accumulation in ZIKV infected or ZIKV-NS1 expressing cells. F Representative confocal image showing mitochondria accumulation in JEG-3 infected with ZIKV-mCherry (MR-766) compared to uninfected cells [MOI = 0.1, 16 hours post-infection (hpi)]. G Comparison of the mean fluorescence intensity (MFI) of mitotracker in uninfected and infected cells via flow cytometry, n = 5, 16 hpi. H Representative confocal imaging showing JEG-3 cells transfected with pNS1-ZIKV showing mitochondria accumulation. I Quantification of mitochondria accumulation via flow cytometry, n = 5, 16 hpt. The confocal images shown are representative of experiments (n = 3) independently repeated with similar results. Images were acquired by confocal microscopy at 40X using a Nikon A1R and processed using the NIS Elements software (Nikon). Data (G and I) is presented by mean ± SEM. Statistical significance was determined by two-sided t-tests. **= P ≤ 0.01, ****= P ≤ 0.0001. Bar = 50 μm (E) and 10 μm (insets), and 25 μm (F, and H). Source data are provided as a Source Data file.
Fig. 6
Fig. 6. ZIKV NS1 induces mitochondrial transfer between cells via TNTs.
A Representative confocal image of HTR-8 cells transfected with pNS1-ZIKV showing mitochondria (arrow) and NS1 transfer via F-actin-rich TNTs. B Cells transfected with pNS1ΔTNT show limited TNT formation and transfer of mitochondria cargo at 24 hours (hrs). Merged images show nuclei (blue), actin (gray), mitochondria (green), and ZIKV-NS1 (red). C Schematic of 24 hrs co-culture assays for determining mitochondria transfer to NS1-expressing cells via flow cytometry as in DI. Percentage of HTR-8 cells (NS1 + , Celltrace-, Mitotracker + ) that acquired mitochondria from untransfected D HTR-8, all groups n = 5; F JEG-3 (PRVABC-59, n = 4; remaining groups n = 5); and H THP-1 MΦ, all groups n = 5. E, G, and I Quantification of mitochondria transfer to HTR-8 NS1-expressing cells (NS1 + , Celltrace-, Mitotracker +) in relation to untransfected cells (NS1-, Celltrace-, Mitotracker + ) as represented by the mitochondria mean fluorescence ratio (MFI). The confocal images shown are representative of experiments (n = 3) independently repeated with similar results. Images were acquired using a Nikon A1R confocal microscope at 40X (A) and 60X (B) oil objectives lens at 1.4 normal aperture (NA) and processed using the NIS Elements software (Nikon). Quantification of mitochondria transfer was performed using the BD LSRFortessa™ cell analyzer, total events collected= 30,000 cells. Flow cytometry results were analyzed using FlowJo™ v10.8 Software (BD Life Sciences). Data are presented as mean ± SEM. Statistical significance was determined by ANOVA followed by Tukey’s multiple comparison test. *= P ≤ 0.05, ***= P ≤ 0.001, ****= P ≤ 0.0001. Bar = 25 μm. Figure 6C was created in BioRender. Source data are provided as a Source Data file.
Fig. 7
Fig. 7. The TNT-forming ability of ZIKV affects IFN response in trophoblasts.
AE Secreted interferon (IFN) levels of ZIKV infected JEG-3 cells. Multiplex assays were performed on supernatants from cells infected with MR-766, PRVABC-59 ZIKV strains, and ZIKVΔTNT at MOI = 0.1 for 48 hours and determined as pg/mL. A IFN-α2 levels are presented as median and interquartile range (IQR) (n = 3, Kruskal-Wallis and Dunn’s multiple comparison tests). B IFN-β, C IFN-γ, D IFN-λ1, and E IFN-λ2/3 levels are presented as mean ± SEM (n = 3, ANOVA and Dunnett’s multiple comparison tests). F Comparing IFN-λ response of JEG-3 and HTR-8 cells to ZIKV infection (n = 3, MOI = 0.1, 48 hours, two-sided t-test, uncorrected P-values). GL ZIKV MR-766 and ZIKVΔTNT infection of JEG-3 and HTR-8 (MOI = 1, 48 hrs, n = 3) cells lead to transcriptional changes in multiple genes involved in the interferon signaling, RNA-sensing pathway. Data are presented as median and IQR [K (JEG-3)] and mean ± SEM [G–L (HTR-8), G–J and L (JEG-3)]. Statistical significance was determined by two-sided T-tests [G-L (HTR-8), G-J and L (JEG-3)], and two-sided Mann-Whitney U test [K (JEG-3)]. *= P ≤ 0.05, **= P ≤ 0.01, ***= P ≤ 0.001, and ****= P ≤ 0.0001. Source data are provided as a Source Data file.
Fig. 8
Fig. 8. Disruption of mitochondrial function and mobility impairs ZIKV replication and modulates the IFN response.
A Rotenone is a reversible mitochondrial electron transport chain complex I inhibitor. B Cytotoxicity of rotenone in JEG-3, n = 4, 48 hrs. C Rotenone inhibits ZIKV growth in JEG-3 infected cells (MOI = 0.1, 48 hrs, n = 3) as determined by plaque assay. D Miro1 reducer induces proteasomal degradation of MIRO1. E Cytotoxicity of Miro1 reducer in JEG-3 cells, n = 4, 48 hrs. F Miro1 reducer inhibits ZIKV growth in JEG-3 infected cells (MOI = 0.1, 48 hrs, n = 3) as determined by plaque assay. G-K IFN levels in ZIKV infected (MOI = 0.1, 48 hrs, n = 4) JEG-3 cells treated with Rotenone (0.01 μM; DMSO 0.0001%) and Miro1 reducer (40 μM; DMSO 0.4%). Secreted IFN levels in ZIKV-infected cells treated with rotenone or Miro1 reducer are expressed in pg/mL. Data are presented as median and interquartile range (G, H) and mean ± SEM (B, C, E, F, I, J, K). Statistical significance was determined by ANOVA followed by Dunnett’s multiple comparison tests (B, C, E, F, I, J, K) and Kruskal-Wallis followed by Dunn’s multiple comparison tests (G, H). *= P ≤ 0.05, ***= P ≤ 0.001, and ****= P ≤ 0.0001. Figures A and D were created in BioRender.129. Source data are provided as a Source Data file.

Update of

References

    1. Duffy, M. R. et al. Zika virus outbreak on Yap Island, Federated States of Micronesia. N. Engl. J. Med.360, 2536–2543 (2009). - PubMed
    1. Cao-Lormeau, V.-M. et al. Zika virus, French polynesia, South pacific, 2013. Emerg. Infect. Dis.20, 1085–1086 (2014). - PMC - PubMed
    1. Hu, T., Li, J., Carr, M. J., Duchêne, S. & Shi, W. The Asian Lineage of Zika Virus: Transmission and Evolution in Asia and the Americas. Virol. Sin.34, 1–8 (2019). - PMC - PubMed
    1. Moore, S. M. et al. Leveraging multiple data types to estimate the size of the Zika epidemic in the Americas. PLoS Negl. Trop. Dis.14, e0008640 (2020). - PMC - PubMed
    1. Paixao, E. S. et al. Population-based surveillance for congenital zika virus syndrome: a latent class analysis of recorded cases from 2015-2018. BMC Pregnancy Childbirth22, 530 (2022). - PMC - PubMed

MeSH terms

Substances