. 2025 Feb 20;16(1):1824.
doi: 10.1038/s41467-025-56486-6.

Deciphering response dynamics and treatment resistance from circulating tumor DNA after CAR T-cells in multiple myeloma

Affiliations

Deciphering response dynamics and treatment resistance from circulating tumor DNA after CAR T-cells in multiple myeloma

Hitomi Hosoya et al. Nat Commun. .

Abstract

Despite advances in treatments, multiple myeloma (MM) remains an incurable cancer where relapse is common. We developed a circulating tumor DNA (ctDNA) approach in order to characterize tumor genomics, monitor treatment response, and detect early relapse in MM. By sequencing 412 specimens from 64 patients with newly diagnosed or relapsed/refractory disease, we demonstrate the correlation between ctDNA and key clinical biomarkers, as well as patient outcomes. We further extend our approach to simultaneously track CAR-specific cell-free DNA (CAR-cfDNA) in patients undergoing anti-BCMA CAR T-cell (BCMA-CAR) therapy. We demonstrate that ctDNA levels following BCMA-CAR inversely correlate with relative time to progression (TTP), and that measurable residual disease (MRD) quantified by peripheral blood ctDNA (ctDNA-MRD) was concordant with clinical bone marrow MRD. Finally, we show that ctDNA-MRD can anticipate clinical relapse and identify the emergence of genomically-defined therapy-resistant clones. These findings suggest multiple clinical uses of ctDNA for MM in molecular characterization and disease surveillance.


Conflict of interest statement

Competing interests: B.J.S.: consultancy: Foresight Diagnostics. M.L.: advisory board/consulting for Janssen, BMS, and Kite. D.M.: patent: Pharmacyclics supporting ibrutinib for chronic graft-vs-host disease. Research funding and consultancy: Pharmacyclics, Kite Pharma, Adaptive Biotechnologies, Novartis, Juno Therapeutics, Celgene, Janssen Pharmaceuticals, Roche, Genentech, Precision Bioscience, Allogene and Miltenyi Biotec. M.S.K: research funding: Nutcracker Therapeutics, CRISPR Therapeutics; Consultancy: Daiichi Sankyo, Myeloid Therapeutics. S.S.: research funding: Magenta Therapeutics, BMS, Allogene, Janssen; Consultancy: Magenta Therapeutics, BMS, Janssen, Sanofi, Oncopeptides, Takeda. D.M.K.: patents: D.M.K. reports issued patents pertaining to ctDNA-MRD detection assigned to Stanford University and licensed to Foresight Diagnostics. Consultancy: Foresight Diagnostics, Roche, Genentech, and Adaptive Biotechnologies. Stock and Equity Ownership: D.M.K. reports equity ownership in Foresight Diagnostics. The remaining authors declare no competing interests.

Figures

Fig. 1
Fig. 1. Potential ctDNA application in multiple myeloma.
Schematic depicting the usage of cell-free DNA assay for disease characterization, treatment response monitoring, CAR T-cell tracking, and early relapse detection. By following sequential samples over the course of treatments, clonal dynamics, as well as treatment resistance mechanisms can be revealed.
Fig. 2
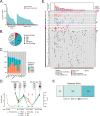
Fig. 2. Single nucleotide variants in multiple myeloma.
A A bar plot showing the distribution of single nucleotide variants in multiple myeloma from WGS data. The genome was divided into 1000-bp bins, and the fraction of patients with a variant in each bin was calculated. Both frequently mutated driver coding genes (navy) and most frequently mutated genomic regions (pink) are highlighted. B, C Number of SNVs identified from genotyping samples (tumor for esophageal and lung cancers; tumor or blood plasma for MM or DLBCL), as well as allele frequencies of ctDNA from pre-treatment samples in order to demonstrate ctDNA detection in MM. Data are presented as mean values ± 95% CI. The p-values were calculated using a two-tailed Wilcoxon rank sum test. p-values were B 8.2e−14 (esophageal vs MM), 2e-15 (lung vs MM), 0.0003 (DLBCL vs MM); C 1.4e-9 (esophageal vs MM), 1.8e-8 (lung vs MM), 0.28 (DLBCL vs MM). ****P < 0.0001, ***P < 0.001, and P > 0.0001. D Number of SNVs identified by our CAPP-Seq assay compared to clinical NGS assay for hematological malignancies for samples that had paired data in our cohort (n = 11). The p-value was calculated by a two-sided Wilcoxon rank-sum test. E The ctDNA detection limits are shown for coding genes only and coding + non-coding genomic regions based on the number of mutations detected in our cohort. Data are presented as mean values ± SD. The p-value was calculated using the Wilcoxon rank sum test, showing 6.9e-16.
Fig. 3
Fig. 3. Profiling of pre-treatment samples by CAPP-Seq.
A A bar plot depicting the number of SNVs detected from genotyping samples (bone marrow aspirate, n = 20; or plasma, “cfDNA”, n = 44). The number of non-coding single-nucleotide variants (SNVs), inclusive of immunoglobulin (Ig) loci, are shown in aqua; the number of coding SNVs not including Ig loci are shown in red. B A pie-chart showing the breakdown of a total of 5145 SNVs detected in Fig. 3A. IGH immunoglobulin heavy chain, IGK immunoglobulin kappa light chain, IGL immunoglobulin lambda light chain. C A bar plot showing the mutational signatures of frequently detected intronic genes (BCL7A, BCL6, LPP/BCL6 super-enhancer region), immunoglobulin loci, and intergenic regions as compared to frequently detected coding mutations in driver genes (KRAS, NRAS, TP53). SBS37, 39, 84, and 85 are highlighted as being associated with AID activity. D An example of tracking coding and non-coding mutations for disease monitoring in a case. Red arrows point to timepoints when coding genes became undetectable but non-coding regions and immunoglobulin loci remained detectable. E An oncoprint showing the coding mutations detected in our cohort (n = 64). Only coding SNVs detected in at least two patients are shown. MGUS/SMM vs MM is identified by the color bar at the bottom. MAPK, mitogen-activated protein kinase; NF-κB, nuclear factor-κB. Source data are provided as a Source Data file. F Venn diagram showing concordance of single nucleotide variants detected from bone marrow (BM) and plasma across 22 paired samples.
Fig. 4
Fig. 4. Correlation of ctDNA with clinical characteristics and therapeutic response.
A–C Levels of ctDNA grouped by disease type. MGUS monoclonal gammopathy of undetermined significance, SMM smoldering myeloma, MM multiple myeloma, ND newly diagnosed, RR relapsed/refractory, EMD extramedullary disease, hGE/mL human genome equivalent per mL of plasma, ND in x-axes, non-detected. Data are presented as mean ± SD. p-values were calculated by a two-sided Wilcoxon rank-sum test. D, E Correlation of ctDNA levels and clinical biomarkers (M-spike and difference between involved and uninvolved free light chains) by linear regression based on secretory disease status. Correlation coefficients and p-values were calculated using a two-tailed Spearman’s rank-order test. F Waterfall plot of quantified molecular response (log10-transformed fold-change in ctDNA from day 0 to day 28 post-treatment). Cases are categorized and color-coded according to the best response as assessed by IMWG criteria. The p-value was calculated by a two-sided Wilcoxon rank-sum test. VGPR very good partial response, PR partial response, SD stable disease, MR minimal response, PD progressive disease.
Fig. 5
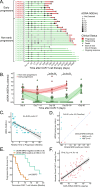
Fig. 5. Application of ctDNA and CAR-cfDNA monitoring to BCMA-CAR therapy.
A A Swimmer plot of the individual patients receiving BCMA-CAR therapy and their follow-up, overlaid by ctDNA levels. Early progressors; patients who progressed within 3 months following BCMA-CAR. Non-early progressors; patients who did not progress within 3 months. B Dynamics of ctDNA after CAR T-cell infusion. Lines indicate the median and interquartile range. p-values on day 28 and day 60–90 were calculated by a two-sided Wilcoxon rank-sum test. C A scatter plot showing a correlation between ctDNA levels on ≥28 days post-CAR and relative TTP from individual time points. Data are presented as linear regression with 95% CI. The p-value was calculated using Spearman’s rank-order test. D Correlation of clinical bone marrow MRD and ctDNA at matched time points. Clinical bone marrow MRD was performed using NGS (ClonoSeq, n = 12) or NGF (n = 4). p-Value was calculated using a two-tailed Sperman’s rank-order test on samples that had the ClonoSeq test (n = 12). The line indicates y = x. E Kaplan–Meier analysis of progression-free survival in patients stratified by ctDNA-MRD positivity on day 90. The p-value was calculated using the log-rank test. F Correlation of CAR-cfDNA with an absolute count of CAR T-cells by flow cytometry at matched time points. Data are presented as linear regression with 95% CI. The p-value was calculated by two-tailed Spearman’s rank-order test.
Fig. 6
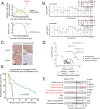
Fig. 6. Genomic determinants of resistance to BCMA-CAR therapy.
A A case of early detection of relapse by ctDNA, showing the dynamics of ctDNA and CAR-cfDNA (upper panel), as well as the dynamics of TNFSRSF17 (BCMA) z-score (lower panel). Open points reflect non-significant q-score indicating the BCMA deletion was not detectable. B Genome-wide copy number profile inferred from cfDNA WGS of the patient depicted in A). Emergent chromosome 16 deletion is magnified to show further focal deletion in TNFRSF17 (BCMA), which was detected by CAPP-Seq. Segmentation was performed using the DNAcopy R package. CNR, copy number ratio. C Immunohistochemistry of the bone marrow core of the patient depicted in A prior to BCMA-CAR (left) and upon relapse (right) demonstrating loss of BCMA. D The volcano plot shows a clonal selection of somatic copy number alterations at individual gene levels in patients who relapsed (n = 23). Positive z-score reflects clonal selection in patients at relapse. p-values were calculated using a two-sided Wilcoxon rank-sum test. Copy number alterations that were significantly clonally selected (p < 0.05) are highlighted in green for amplifications, and red for deletions. E Kaplan–Meier analysis of progression-free survival in patients with and without underlying copy number loss of BCMA prior to treatment. F Forest plot of variable effects on time to progression (n = 36). The plot depicts hazard ratios ± SD calculated by a univariate Cox proportional hazards regressions model, with significant values shown in red (p < 0.05). Error bars reflect a 95% confidence interval.

References

    1. Kumar, S. K. et al. Continued improvement in survival in multiple myeloma: changes in early mortality and outcomes in older patients. Leukemia28, 1122–1128 (2014). - PMC - PubMed
    1. Braunlin, M., Belani, R., Buchanan, J., Wheeling, T. & Kim, C. Trends in the multiple myeloma treatment landscape and survival: a U.S. analysis using 2011–2019 oncology clinic electronic health record data. Leuk. Lymphoma62, 377–386 (2021). - PubMed
    1. Binder, M. et al. Mortality trends in multiple myeloma after the introduction of novel therapies in the United States. Leukemia36, 801–808 (2022). - PubMed
    1. Corre, J. et al. Improved survival in multiple myeloma during the 2005–2009 and 2010–2014 periods. Leukemia35, 3600–3603 (2021). - PubMed
    1. Munshi, N. C. & Avet-Loiseau, H. Genomics in multiple myeloma. Clin. Cancer Res.17, 1234–1242 (2011). - PMC - PubMed

MeSH terms