. 2025 Feb 21;16(1):1833.
doi: 10.1038/s41467-025-56889-5.

Increasingly efficient chromatin binding of cohesin and CTCF supports chromatin architecture formation during zebrafish embryogenesis

Affiliations

Increasingly efficient chromatin binding of cohesin and CTCF supports chromatin architecture formation during zebrafish embryogenesis

Jonas Coßmann et al. Nat Commun. .

Abstract

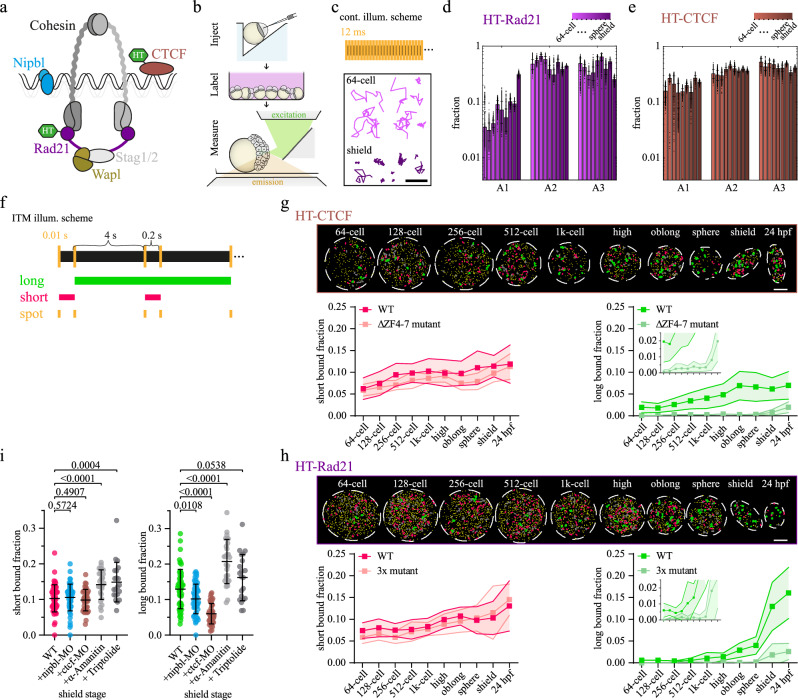
The three-dimensional folding of chromosomes is essential for nuclear functions such as DNA replication and gene regulation. The emergence of chromatin architecture is thus an important process during embryogenesis. To shed light on the molecular and kinetic underpinnings of chromatin architecture formation, we characterized biophysical properties of cohesin and CTCF binding to chromatin and their changes upon cofactor depletion using single-molecule imaging in live developing zebrafish embryos. We found that chromatin-bound fractions of both cohesin and CTCF increased significantly between the 1000-cell and shield stages, which we could explain through changes in both their association and dissociation rates. Moreover, increasing binding of cohesin restricted chromatin motion, potentially via loop extrusion, and showed distinct stage-dependent nuclear distribution. Polymer simulations with experimentally derived parameters recapitulated the experimentally observed gradual emergence of chromatin architecture. Our findings reveal molecular kinetics underlying chromatin architecture formation during zebrafish embryogenesis.


Conflict of interest statement

Competing interests: The authors declare no competing interests.

Figures

Fig. 1
Fig. 1. Cohesin and CTCF bind chromatin increasingly more efficient during zebrafish development.
a Scheme of the cohesin complex. b Scheme outlining the workflow of zebrafish measurements. c Top: Scheme of continuous illumination. Bottom: Example single-molecule tracks of the 64-cell stage (bright pink) and shield stage (dark pink). Scale bar: 1 µm. Fractions of a three-component diffusion model fitted to jump distance distributions of (d) HT-Rad21 and (e) HT-CTCF. Colors indicate stages of development (64-, 128-, 256-, 512-, 1k-cell, high, oblong, sphere, shield). Bars represent mean values ± s.d. from 500 resamplings using 80% of randomly selected jump distances. For fits and diffusion coefficients see Supplementary Fig. 6-8 and statistics in Supplementary Table 1. f Scheme of interlaced time-lapse microscopy (ITM). Molecules are classified into different binding classes. Long (green): tracks surviving at least two long dark times (8.2 s). Short (red): Tracks surviving one short dark time (0.2 s). Spot (yellow): Molecules only detected in a single frame. Top: Example nuclei of (g) HT-Rad21 and (h) HT-CTCF ITM movies with tracks colored according to the binding classes in panel (f). Grey tracks survived only one long dark time. Scale bar: 5 µm. Bottom: Fractions of short and long binding events of (g) HT-Rad21 (WT) or HT-Rad21-3x mutant and (h) HT-CTCF (WT) or HT-CTCF-ΔZF4-7 mutant. Data represent mean ± s.d. of movie-wise determined fractions. Insets show zooms into the respective graphs. Lines serve as guides to the eye. Statistics and p-Values are provided in Supplementary Table 2–7. Raw data plots are provided in Supplementary Fig. 9. i Fractions of short (left) and long (right) binding events of HT-Rad21 (WT) in the presence of morpholinos (MO) or RNA-polymerase inhibitors in the shield stage. Data represent mean ± s.d. of movie-wise determined fractions. All developmental stages are shown in Supplementary Fig. 14 and 16. P-values were calculated using two-sided Multiple Mann-Whitney test with a false discovery rate set to 1% (Supplementary Tables 8, 9). Source data are provided as a Source Data file for Fig. 1d, e, gi.
Fig. 2
Fig. 2. Long-bound cohesin confines chromatin motion and shows distinct nuclear localization.
a Schemes of time-lapse illumination alternated with continuous intervals (TACO). Molecules are classified in short and long-bound binding classes comparable to ITM (Fig. 1f) and analyzed during continuous intervals (dark green and dark red bars, see Methods). b Mean jump distances of HT-Rad21 molecules classified as short bound (circles) and long bound (squares) at different developmental phases. pre-ZGA (red): 64-, 128-, 256, 512-cell stages pooled; post-ZGA (green): high, oblong, sphere stages pooled; shield stage (blue) and shield stage with the addition of nibpl-morpholino (MO, cyan). Insets: example tracks. Data represent mean ± s.d. P-values were calculated using a two-sided Kruskal-Wallis test followed by Dunn’s multiple comparison test and Multiple Mann-Whitney test with a false discovery rate set to 1% (see p-values in Supplementary Table 10 and statistics in Supplementary Table 11). Scale bar: 1 µm. c Sketch of cohesin-mediated decrease in chromatin motion. d Left: Example nucleus (bold white circle) subdivided into five bins (dotted lines) with the initial positions of long-bound HT-Rad21 tracks (pink). Right: Pooled initial positions of long-bound tracks of all ITM- and TACO measurements at pre-ZGA stages shown in a unit circle. For post-ZGA and shield stage, see Supplementary Fig. 24. e HT-Rad21 track counts per radial bin (compare panel (d), right) normalized to bin area and the highest bin value. Data represented as value ± statistical error (square root of track counts per bin). Statistics are provided in Supplementary Tables 6 and 11. CBD Center-Border-Distance. Source data are provided as a Source Data file for Fig. 2b, e.
Fig. 3
Fig. 3. Binding kinetics of cohesin and CTCF change during zebrafish embryogenesis.
a Scheme depicting the rate constants of chromatin association (kon) and dissociation (koff) of HT-Rad21 and HT-CTCF. b Schemes of continuous illumination. c Left: Kymographs propagating with the spot-center of continuous and 4.5 s time-lapse illumination. Right: Corresponding tracks, color-coded according to time. Scale bar: 1 µm. Survival time distributions of (d) HT-Rad21 and (e) HT-CTCF of different time-lapse conditions indicated on the top and the respective GRID fits (dashed lines). pre-ZGA (red): 64-, 128-, 256, 512-cell stages pooled; post-ZGA (green): high, oblong, sphere stages pooled; shield (blue). Statistics are provided in Supplementary Table 14. GRID state spectra of dissociation rates of (f) HT-Rad21 and (g) HT-CTCF using all data (solid line, colored according to stages) and 500 resampling runs with randomly selected 80% of data (black spots) as an error estimation of the spectra. Grey insets: Average residence times and percentages of dissociation rates larger or smaller than 0.1 s−1 (dashed line). Detailed residence times and fractions are provided in Supplementary Tables 12−13. h Measured bound fractions (circle) and bound fractions calculated from kinetic rates (square) of HT-CTCF (left) and HT-Rad21 (right). Data represented as value ± s.d. (Gaussian error propagation (see Methods). Statistics are provided in Supplementary Tables 1 and 14. i Search times (inverse on-rates) for a single HT-CTCF or HT-Rad21 molecule to find any binding site (Methods and Supplementary Tables 15−16). j Relative effective search times for any HT-CTCF or HT-Rad21 molecule to find any specific binding site. Data represented as value ± s.d. (Gaussian error propagation). Calculated values in (h)–(j) are based on data in (d), (e) and Fig. 1d, e. Statistics are provided in Supplementary Tables 1 and 14. k Scheme depicting the concentration model: During early embryo development, the nuclear volume (outer black circle) decreases, CTCF- (brown) and cohesin (purple) molecule counts, and accessible CTCF binding sites increase. Changes in kinetic rates are depicted as variations in arrow width and color. unsp: unpecific, sp: specific binding. Source data are provided as a Source Data file for Fig. 3d–j.
Fig. 4
Fig. 4. Simulated contact maps including single-molecule data recapitulate experimental contact maps.
a Contact maps of a polymer model with 1 kb mapping for pre-ZGA (left) or shield stages (right). Data is averaged across 10 independent runs. b Contact maps derived from a published Hi-C dataset for 2.25 hpf (hours post fertilization, similar to pre-ZGA) and 5.3 hpf (similar to shield). c Contact probability P(s) derived from the maps shown in (a) as a function of genomic distance. The table indicates simulation parameters for Speed of extrusion (S), Processivity of an extruder (P), and Density of extruders on chromatin (D) in pre-ZGA (red) and shield stage (blue). d Same as panel (c) but for Hi-C contacts maps from panel b. e Ratio of P(s) slopes between the shield and pre-ZGA stages using modeling data from panel (c). f Ratio of P(s) slopes between 5.3 hpf and 2.25 hpf for slopes of P(s) from panel d. g Pile-up plots representing average observed contact probabilities divided by expected (average contact probabilities at the same genomic distance) in +/−100kb windows around accessible CTCF sites for different developmental stages. The top row represents modeling, and the bottom row is experimental Hi-C data. h Scheme depicting the emergence of cohesin-mediated loops and CTCF binding due to altered binding kinetics of both species during early zebrafish development.

Similar articles

Cited by

References

    1. Cremer, T. & Cremer, M. Chromosome territories. Cold Spring Harb. Perspect. Biol.2, a003889 (2010). - PMC - PubMed
    1. Lieberman-Aiden, E. et al. Comprehensive mapping of long-range interactions reveals folding principles of the human genome. Science326, 289–293 (2009). - PMC - PubMed
    1. Zhang, Y. et al. Spatial organization of the mouse genome and its role in recurrent chromosomal translocations. Cell148, 908–921 (2012). - PMC - PubMed
    1. Dixon, J. R. et al. Topological domains in mammalian genomes identified by analysis of chromatin interactions. Nature485, 376–380 (2012). - PMC - PubMed
    1. Nora, E. P. et al. Spatial partitioning of the regulatory landscape of the X-inactivation centre. Nature485, 381–385 (2012). - PMC - PubMed

MeSH terms

LinkOut - more resources