. 2025 Feb 20;16(1):119.
doi: 10.1038/s41419-025-07438-x.

Tubular CD44 plays a key role in aggravating AKI through NF-κB p65-mediated mitochondrial dysfunction

Affiliations

Tubular CD44 plays a key role in aggravating AKI through NF-κB p65-mediated mitochondrial dysfunction

Jiewu Huang et al. Cell Death Dis. .

Abstract

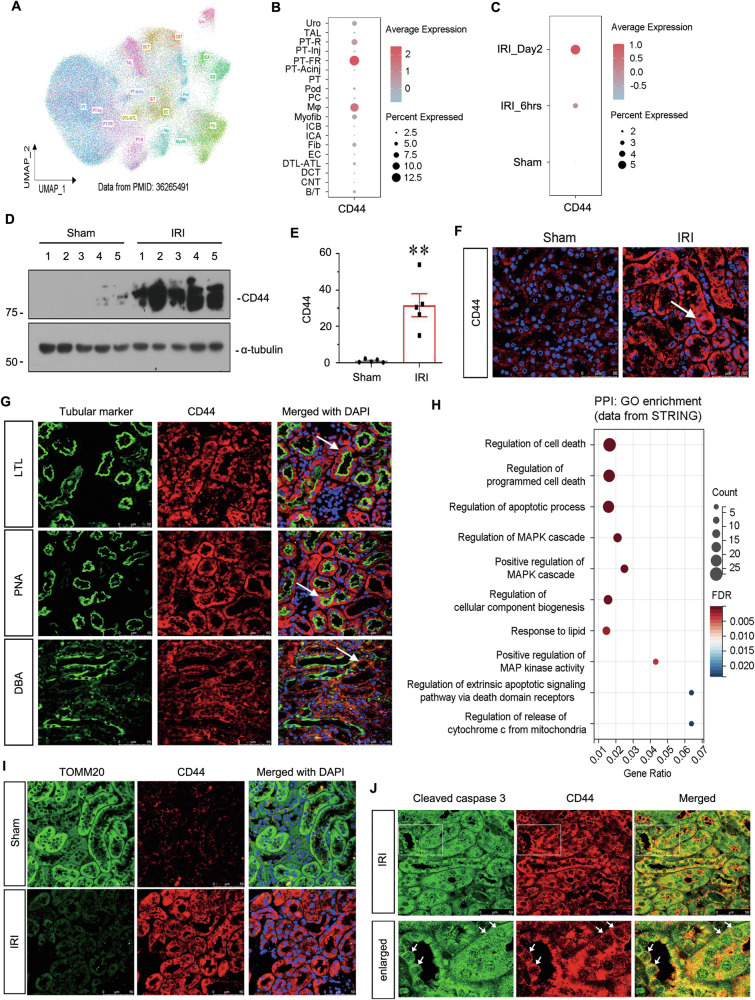
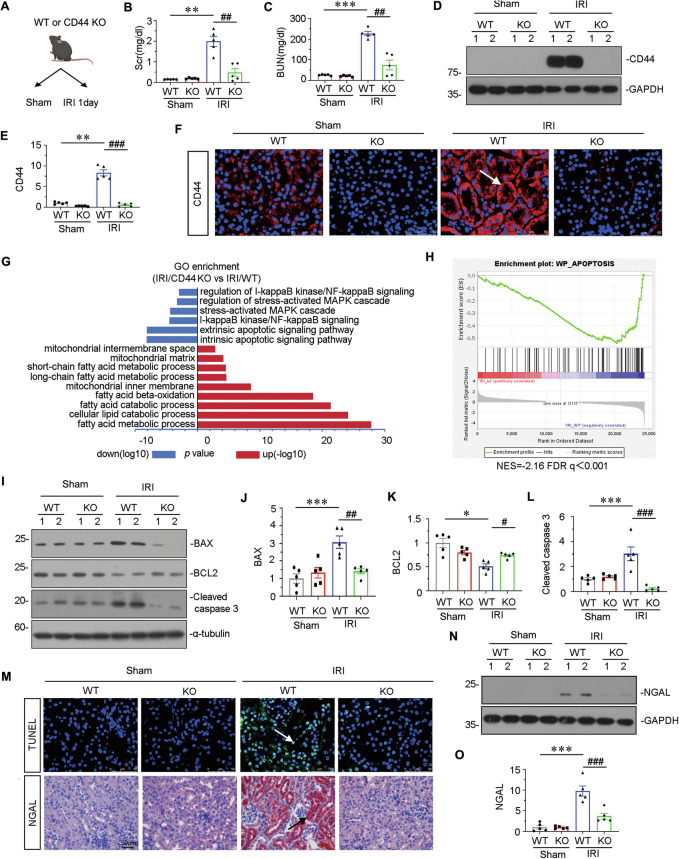
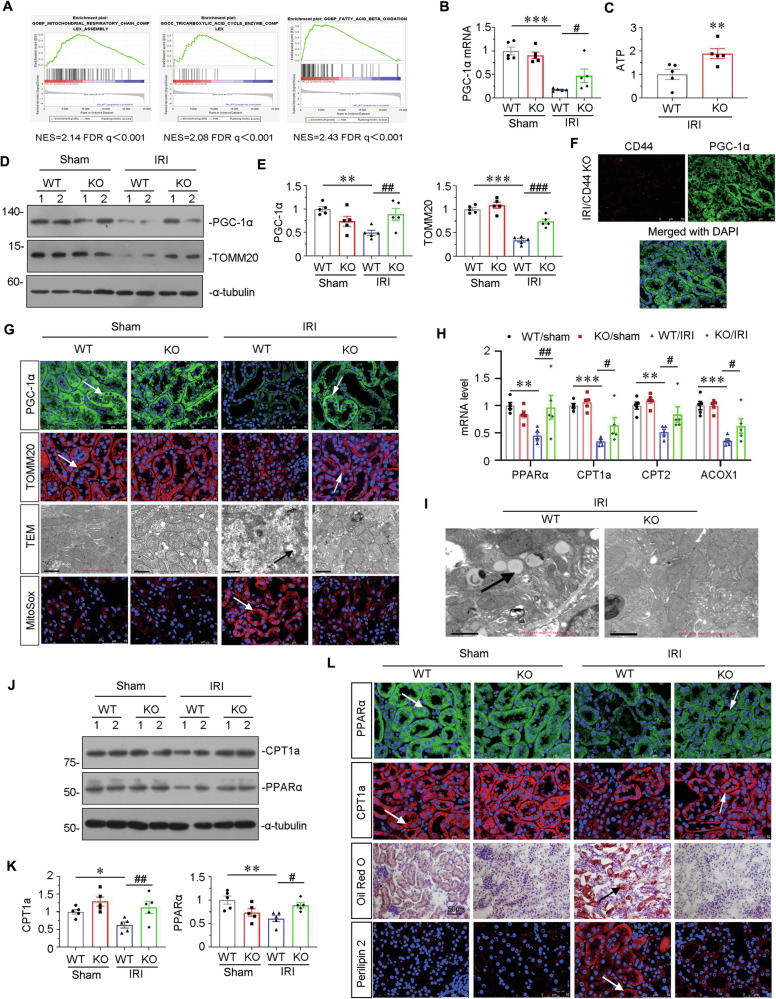
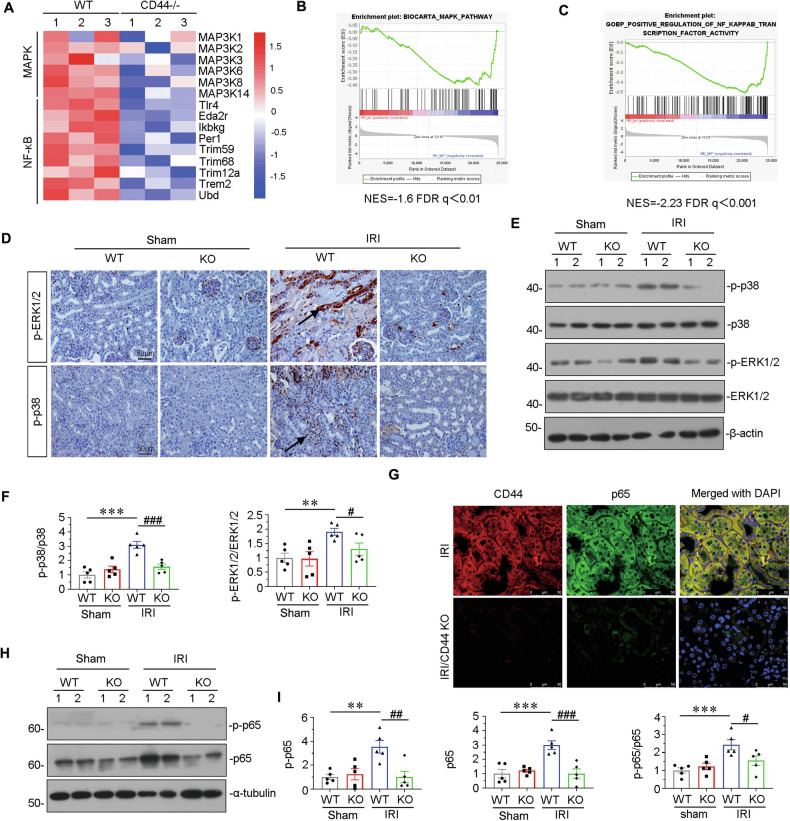
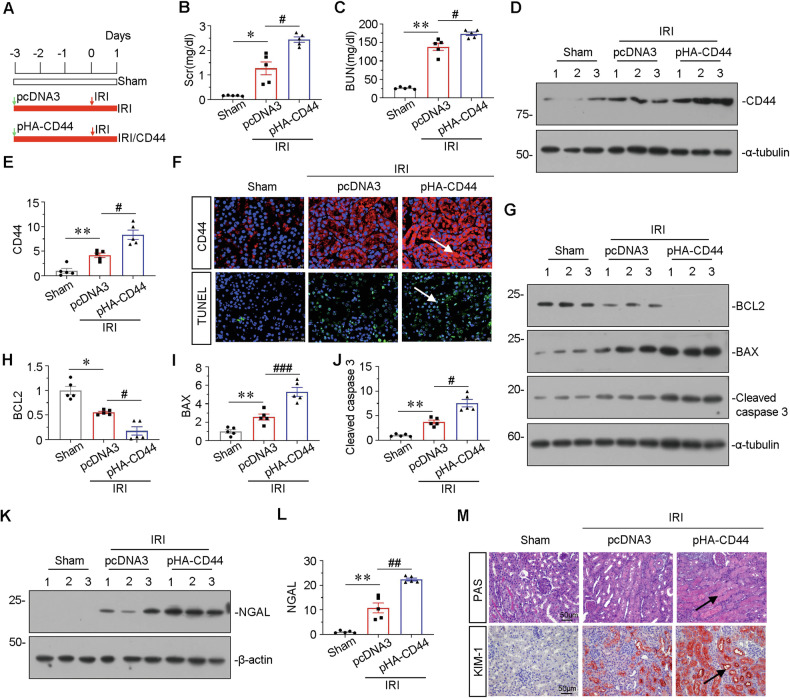
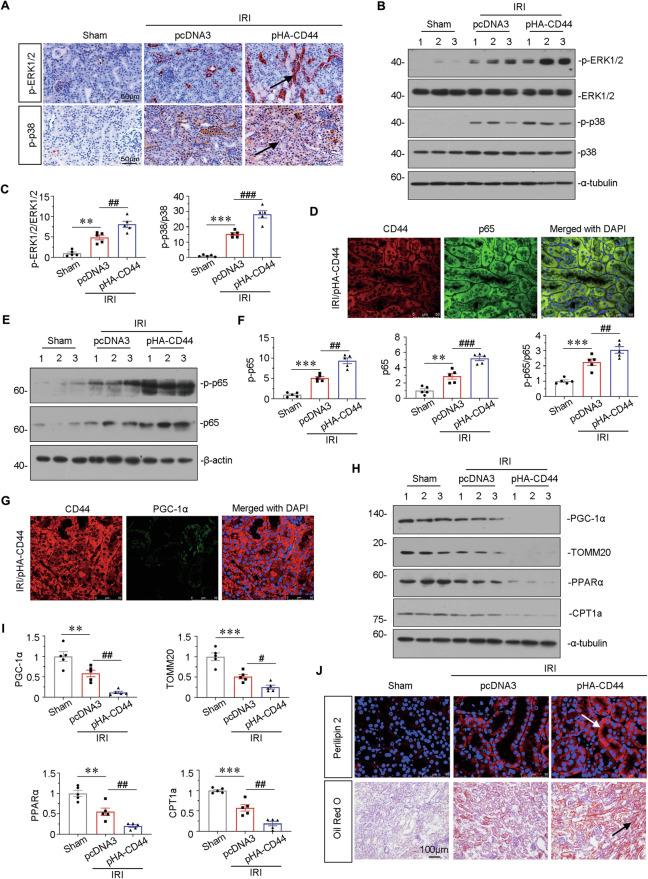
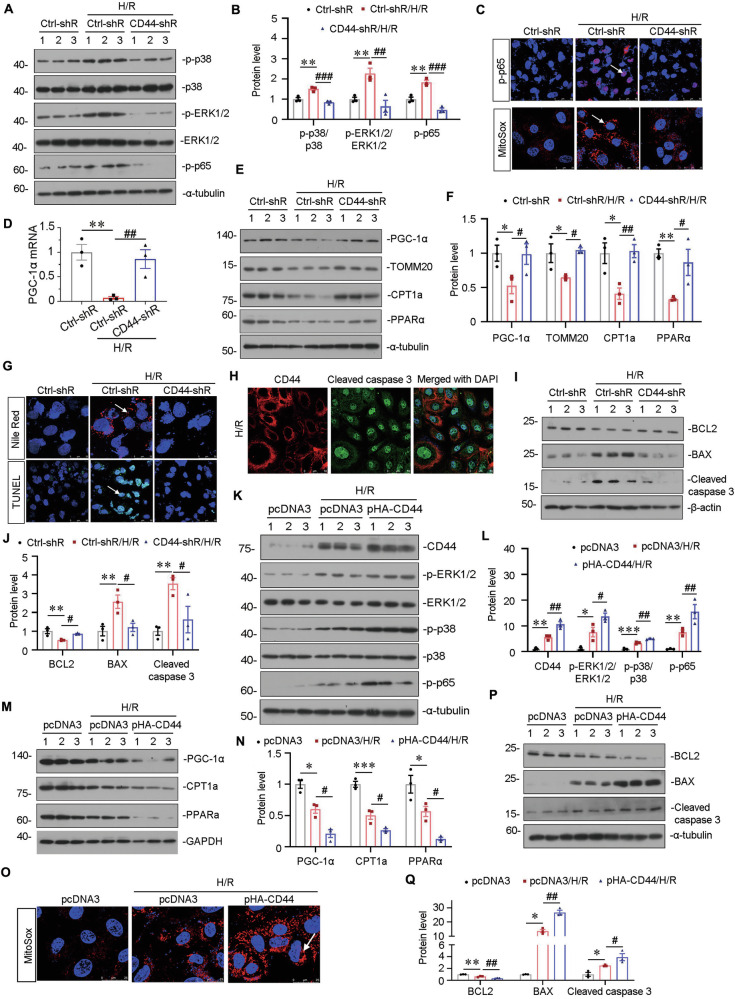
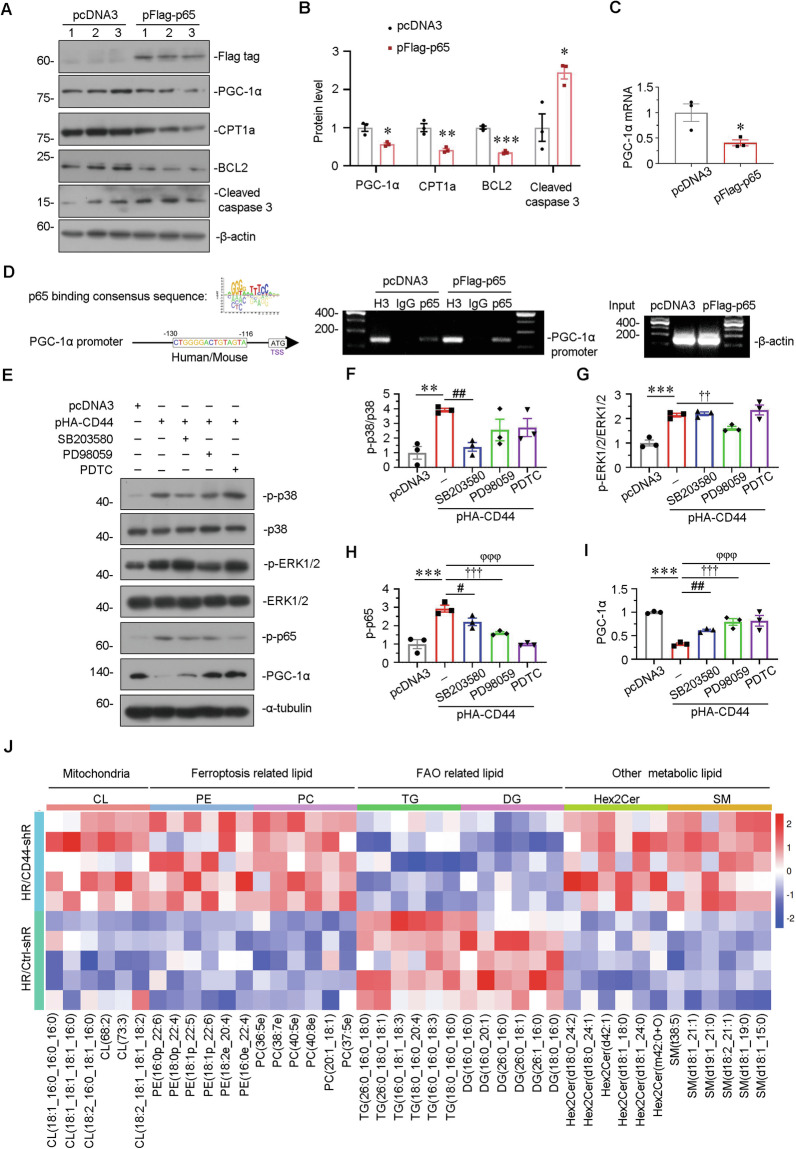
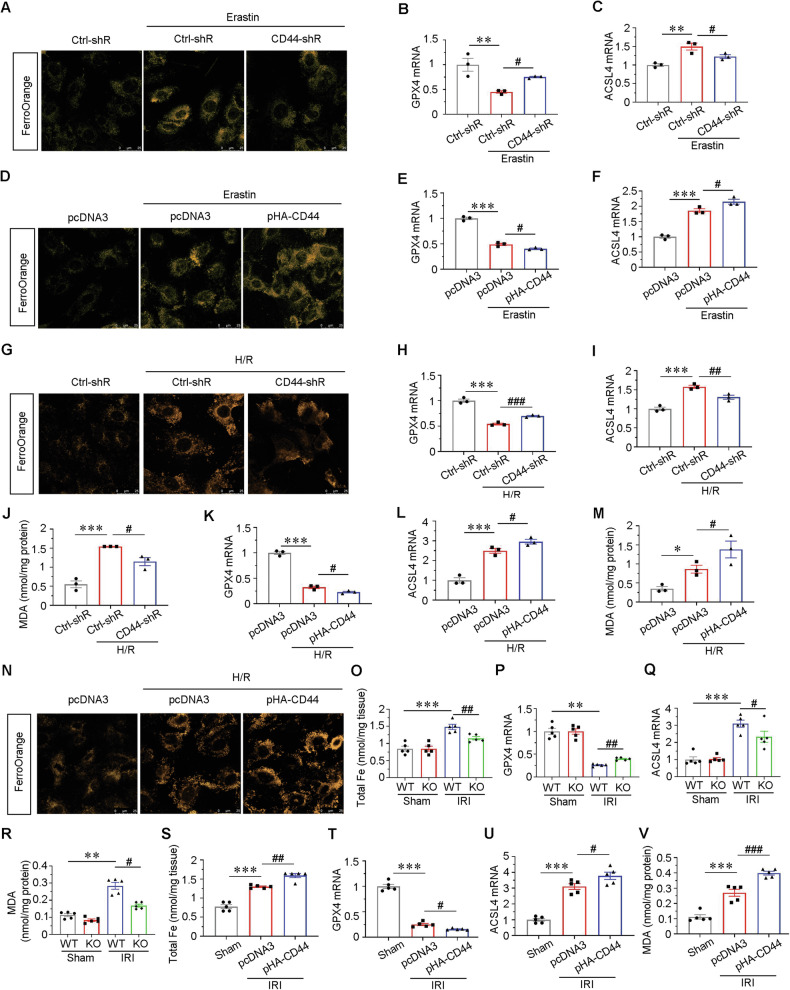
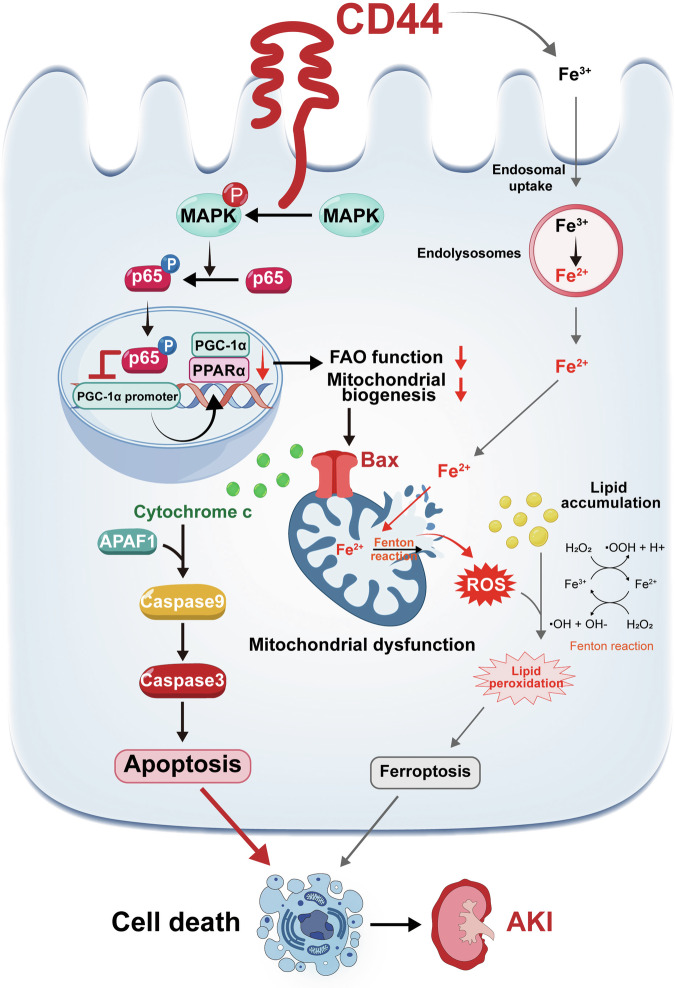
Acute kidney injury (AKI) is in rapid prevalence nowadays. Of note, the underlying mechanisms have not been clarified. Several reports showed a cluster of differentiation-44 (CD44), a cell-surface glycoprotein, might be involved in AKI. However, its role in AKI has not been clearly clarified. Herein, we found CD44 increased in renal tubules in AKI mice. Gene ablation of CD44 improved mitochondrial biogenesis and fatty acid oxidation (FAO) function, further protecting against tubular cell death and kidney injury. Conversely, ectopic CD44 impaired mitochondrial homeostasis and exacerbated tubular cell apoptosis to aggravate AKI progression. From transcriptome sequencing, we found that CD44 induces mitogen-activated protein kinase (MAPK) and NF-κB p65 signaling. Lipidomics also showed that CD44 interfered with multiple aspects of lipid metabolism. We deeply investigated NF-κB p65 inhibited the transcription of peroxisome proliferator-activated receptor gamma coactivator 1-alpha (PGC-1α), resulting in mitochondrial dysfunction and cell apoptosis. CD44 also facilitated iron intake to assist cell ferroptosis. Hence, our study provided a new mechanism for AKI, and demonstrated that targeted inhibition on CD44 could be a promising therapeutic strategy to resist AKI.


Conflict of interest statement

Competing interests: The authors declare no competing interests. Ethics statement: The animal experiments were approved by the Ethics Committee on Use and Care of Animals of Southern Medical University, Guangzhou, China.

Figures

Fig. 1
Fig. 1. CD44 is upregulated in TECs and associated with mitochondrial dysfunction and apoptosis.
A UMAP shows cell population in kidneys of sham and IRI at 6 h and day 2. PT proximal tubule, PT-Inj injured PT, PT-R repairing PT, FR-PTC failed repair PT cell, PT-AcInj acute injury PT, DTL descending limb of loop of Henle (LoH), ATL thin ascending limb of LoH, TAL thick ascending limb of LoH, DCT distal convoluted tubule, CNT connecting tubule, PC principal cell of collecting duct, ICA type A intercalated cell of collecting duct, ICB type B intercalated cell of collecting duct, Pod podocyte, EC endothelial cell, Fib fibroblast, Myofib myofibroblast, Ma macrophage (Mφ), B/T immune cell, Uro urothelium. Data from PMID: 36265491. B Graphic presentation of single-cell sequencing analysis shows the expression of CD44 in different cell populations. C Graphic presentation of single-cell sequencing analysis shows the expression of CD44 at different time point. D and E Representative western blot of CD44 (D) and graphical presentations (E) of protein expressional levels are shown. **P < 0.01 versus sham group (n = 5). F Representative micrographs show the expression of CD44 in sham and IRI groups, as indicated. Frozen kidney sections were stained with an antibody against CD44. Arrow indicates positive staining. Scale bar, 50 μm. G Co-localization staining of CD44 and various segment-specific tubular markers in the kidneys of the IRI model. Frozen kidney sections were collected from the mice 1 day after IRI. CD44 (red) and various segment-specific tubular markers (green), including LTL, PNA, and DBA, were detected by immunofluorescence. Arrows indicate positive staining. Scale bar, 50 μm. H GO analysis of CD44-related pathway through STRING (https://cn.string-db.org/). I Co-localization of CD44 and TOMM20 in tubules. Frozen renal sections were subjected to immunostaining of CD44 (red) and TOMM20 (green). Scale bar, 50 μm. J Co-localization of CD44 and cleaved caspase 3 in IRI group. Frozen kidney sections were subjected to immunostaining of CD44 (red) and cleaved caspase 3 (green). Scale bar, 50 μm.
Fig. 2
Fig. 2. Gene ablation of CD44 attenuates renal tubular cell apoptosis and kidney injury upon IRI.
A Experimental design: Wild-type mice and CD44 conventional knockout mice were subjected to IRI or sham, respectively, and euthanized 24 h after IRI. B Scr levels in four groups, as indicated. Scr was expressed as milligrams per deciliter. **P < 0.01 versus wild-type mice upon sham group; ##P < 0.01 versus wild-type mice upon IRI group (n = 5). C BUN levels in four groups, as indicated. BUN was expressed as milligrams per deciliter. ***P < 0.001 versus wild-type mice upon sham group; ##P < 0.01 versus wild-type mice upon IRI group (n = 5). D and E Representative western blot of CD44 (D) and graphical presentations (E) of protein expressional levels are shown. **P < 0.01 versus wild-type mice upon sham group; ###P < 0.001 versus wild-type mice upon IRI group (n = 5). F Representative micrographs show the expression of CD44 in different groups, as indicated. Frozen kidney sections were stained with an antibody against CD44. Arrow indicates positive staining. Scale bar, 50 μm. G GO analysis shows CD44 is involved with several important pathways, including MAPK, NF-κB, apoptosis, mitochondria and FAO. H GSEA shows that negative regulation of apoptosis was enriched in CD44 knockout mice versus wild-type mice upon IRI. NES, normalized enrichment score; FDR q-value < 0.25. I–L Representative western blot (I) and graphical presentations of J BAX, K BCL2, and L cleaved caspase 3 protein expressional levels are shown. *P < 0.05, ***P < 0.001 versus wild-type mice upon sham group; #P < 0.05, ##P < 0.01, ###P < 0.001 versus wild-type mice upon IRI group (n = 5). M Representative micrographs show TUNEL assay in different groups, as indicated. Frozen kidney sections were subjected to TUNEL assay. Parrafin sections were performed by immunohistochemistry staining of NGAL. Arrow indicates positive staining. Scale bar, 50 μm. N and O Representative western blot of NGAL (N) and graphical presentations (O) of protein expressional levels are shown. ***P < 0.001 versus wild-type mice upon sham group; ###P < 0.001 versus wild-type mice upon IRI group (n = 5).
Fig. 3
Fig. 3. CD44 knockout ameliorates mitochondrial dysfunction and FAO deficiency in IRI mice.
A GSEA shows that positive regulation of mitochondrial function and FAO was enriched in CD44 knockout mice versus wild-type mice upon IRI. NES, normalized enrichment score; FDR q-value < 0.25. B Graphic presentation shows the relative levels of renal expression of PGC-1α mRNA in different groups as indicated. ***P < 0.001 versus wild-type mice upon sham group; #P < 0.05 versus wild-type mice upon IRI group (n = 5). C Graphic presentation shows the relative levels of ATP production in 2 groups as indicated. **P < 0.01 versus wild-type upon IRI group (n = 5). D and E Representative western blot (D) and graphical presentations of PGC-1α and TOMM20 protein expression levels are shown. **P < 0.01, ***P < 0.001 versus wild-type mice upon sham group; ##P < 0.01, ###P < 0.001 versus wild-type mice upon IRI group (n = 5). F Co-localization of CD44 and PGC-1α in CD44 gene ablation mice upon IRI. Frozen kidney sections were subjected to immunostaining of CD44 (red) and PGC-1α (green). Scale bar, 50 μm. G Representative micrographs show the expression of PGC-1α, TOMM20, mitochondrial morphology via TEM, and mitochondrial ROS via MitoSox staining in different groups, as indicated. Arrows indicate positive staining or impaired mitochondria. Scale bar, 50 or 1 μm, as indicated. H Graphic presentation shows the relative mRNA levels of renal expression of PPARα, CPT1, CPT2, and ACOX1 mRNA in different groups as indicated. **P < 0.01, ***P < 0.001 versus wild-type mice upon sham group; #P < 0.05, ##P < 0.01 versus wild-type mice upon IRI group (n = 5). I Representative micrographs show the abundance of LDs via TEM in 2 groups, as indicated. Arrows indicate LDs. Scale bar, 1 μm. J and K Representative western blot (J) and graphical presentations of CPT1a and PPARα protein expression levels are shown. *P < 0.05, **P < 0.01 versus wild-type mice upon sham group; #P < 0.05, ##P < 0.01 versus wild-type mice upon IRI group (n = 5). L Representative micrographs show the expression of PPARα, CPT1a, perilipin 2, and LDs via Oil Red O staining in different groups, as indicated. Arrows indicate positive staining. Frozen kidney sections were subjected to Oil Red O staining or stained with antibodies against PPARα, CPT1a, and perilipin 2. Scale bar, 50 μm.
Fig. 4
Fig. 4. CD44 promotes AKI progression through inducing MAPK and NF-κB p65 signaling.
A Representative heatmap gene expression of RNA sequencing analysis shows that CD44 is involved with MAPK and NF-κB signaling pathway. B and C GSEA shows that negative regulation of MAPK and NF-κB pathway was enriched in CD44 knockout mice versus wild-type mice upon IRI. NES, normalized enrichment score; FDR q-value < 0.25. D Representative micrographs show the expression of p-ERK1/2 and p-p38 in different groups, as indicated. Paraffin sections were stained with antibodies against p-ERK1/2 and p-p38. Arrows indicate positive staining. Scale bar, 50 μm. E and F Representative western blot (E) and graphical presentations of p-p38/p38 and p-ERK1/2/ERK1/2 protein levels are shown. **P < 0.01, ***P < 0.001 versus wild-type mice upon sham group; #P < 0.05, ###P < 0.001 versus wild-type mice upon IRI group (n = 5). G Co-localization of CD44 and p65 in 2 groups, as indicated. Frozen kidney sections were subjected to immunostaining of CD44 (red) and p65 (green). Scale bar, 50 μm. H and I Representative western blot (H) and graphical presentations of p-p65, p65, and p-p65/p65 protein levels are shown. **P < 0.01, ***P < 0.001 versus wild-type mice upon sham group; #P < 0.05, ##P < 0.01, ###P < 0.001 versus wild-type mice upon IRI group (n = 5).
Fig. 5
Fig. 5. Ectopic CD44 aggravates tubular cell apoptosis and kidney injury in IRI mice.
A Experimental design: Green arrow indicated the injection of pcDNA3 plasmid or p-HA-CD44 overexpression plasmid. Mice were subjected to IRI surgery or sham surgery, respectively, as shown in the red arrow. Mice are euthanized 24 h after surgery. B Scr levels in three groups, as indicated. Scr was expressed as milligrams per deciliter. *P < 0.05 versus sham group; #P < 0.05 versus IRI group injected with pcDNA3 (n = 5). C BUN levels in three groups, as indicated. BUN was expressed as milligrams per deciliter. **P < 0.01 versus sham group; #P < 0.05 versus IRI group injected with pcDNA3 (n = 5). D and E Representative western blot of CD44 (D) and graphical presentations (E) of protein levels are shown. **P < 0.01 versus sham group; #P < 0.05 versus IRI group injected with pcDNA3 (n = 5). F Representative micrographs show the expression of CD44, and TUNEL assay in different groups, as indicated. Arrows indicate positive staining. Frozen kidney sections were subjected to TUNEL assay or stained with an antibody against CD44. Scale bar, 50 μm. G–J Representative western blot (G) and graphical presentations of H BCL2, I BAX, and J cleaved caspase 3 protein expression levels are shown. *P < 0.05, **P < 0.01 versus sham group; #P < 0.05, ###P < 0.001 versus IRI group injected with pcDNA3 (n = 5). K and L Representative western blot of NGAL (K) and graphical presentations (L) of protein levels are shown. **P < 0.01 versus sham group; ##P < 0.01 versus IRI group injected with pcDNA3 (n = 5). M Representative micrographs show renal tubular morphologic injury and the expression of KIM-1 in different groups, as indicated. Paraffin sections were subjected to PAS staining, and were stained with an antibody against KIM-1. Arrows indicate positive staining. Scale bar, 50 μm.
Fig. 6
Fig. 6. Ectopic expression of CD44 impairs mitochondrial function and FAO through activating MAPK and NF-κB p65 signaling.
A Representative micrographs show the expression of p-ERK1/2 and p-p38 in different groups, as indicated. Paraffin sections were stained with antibodies against p-ERK1/2 and p-p38. Arrows indicate positive staining. Scale bar, 50 μm. B and C Representative western blot (B) and graphical presentations of p-ERK1/2/ERK1/2 and p-p38/p38 protein levels are shown. **P < 0.01, ***P < 0.001 versus sham group; ##P < 0.01, ###P < 0.001 versus IRI group injected with pcDNA3 (n = 5). D Co-localization of CD44 and p65 in CD44 overexpression mice upon IRI. Frozen renal sections were subjected to immunostaining of CD44 (red) and p65 (green). Scale bar, 50 μm. E and F Representative western blot (E) and graphical presentations of p-p65, p65, and p-p65/p65 protein levels are shown. **P < 0.01, ***P < 0.001 versus sham group; ##P < 0.01, ###P < 0.001 versus IRI group injected with pcDNA3 (n = 5). G Co-localization of CD44 and PGC-1α in CD44 overexpression mice upon IRI. Frozen renal sections were subjected to immunostaining of CD44 (red) and PGC-1α (green). Scale bar, 50 μm. H and I Representative western blot (H) and graphical presentations of PGC-1α, TOMM20, PPARα, and CPT1a protein expression levels are shown. **P < 0.01, ***P < 0.001 versus sham group; #P < 0.05, ##P < 0.01 versus IRI group injected with pcDNA3 (n = 5). J Representative micrographs show the expression of perilipin 2, and LDs via Oil Red O staining in different groups, as indicated. Frozen kidney sections were subjected to Oil Red O staining or stained with an antibody against perilipin 2. Arrows indicate positive staining. Scale bar, 50 or 100 μm.
Fig. 7
Fig. 7. CD44 aggravates mitochondrial and FAO dysfunction and drives cell apoptosis through MAPK and NF-κB p65 signaling in vitro.
A and B HKC-8 was transfected with Ctrl-shR or CD44-shR and then were incubated in basal culture medium in a 1% O2 environment for 24 h and then were reoxygenated in normal O2 for 6 h. Representative western blot (A) and graphical presentations of p-p38/p38, p-ERK1/2/ERK1/2, and p-p65 protein expression levels are shown. **P < 0.01 versus Crtl-shR group; ##P < 0.01, ###P < 0.001 versus H/R with Crtl-shR group (n = 3). C Representative micrographs show the expression of p-p65 and MitoSox staining in different groups, as indicated. Arrows indicate positive staining. Cells cultured on coverslips were stained with an antibody against p-p65 or were stained with MitoSox. Scale bar, 25 or 50 μm. D Graphic presentation shows the relative mRNA levels of PGC-1α in different groups as indicated. **P < 0.01 versus Crtl-shR group; ##P < 0.01 versus H/R with Crtl-shR group (n = 3). E and F Representative western blot (E) and graphical representations of PGC-1α, TOMM20, CPT1a, and PPARα protein expression levels are shown. *P < 0.05, **P < 0.01 versus Crtl-shR group; #P < 0.05, ##P < 0.01 versus H/R with Crtl-shR group (n = 3). G Representative micrographs show Nile Red staining and TUNEL assay in different groups, as indicated. Arrows indicate positive staining. Cells cultured on coverships were stained with Nile Red or TUNEL assay. Scale bar, 25 or 50 μm. H Co-localization of CD44 and cleaved caspase 3 in HKC-8 after H/R treatment. Cells cultured on coverships were subjected to immunostaining of CD44 (red) and cleaved caspase 3 (green). Scale bar, 50 μm. I and J Representative western blot (I) and graphical representations of BCL2, BAX, and cleaved caspase 3 protein expression levels are shown. **P < 0.01 versus Crtl-shR group; #P < 0.05 versus H/R with Crtl-shR group (n = 3). K and L HKC-8 was transfected with pcDNA3 or p-HA-CD44 overexpression plasmid and then were incubated in basal culture medium in a 1% O2 environment for 24 h and then were reoxygenated in normal O2 for 6 h. Representative western blot (K) and graphical representations of CD44, p-ERK1/2/ERK1/2, p-p38/p38 and p-p65 protein expression levels are shown. *P < 0.05, **P < 0.01, ***P < 0.001 versus pcDNA3 group; #P < 0.05, ##P < 0.01 versus H/R with pcDNA3 group (n = 3). M and N Representative western blot (M) and graphical presentations of PGC-1α, CPT1a, and PPARα protein expression levels are shown. *P < 0.05, ***P < 0.001 versus pcDNA3 group; #P < 0.05 versus H/R with pcDNA3 group (n = 3). O Representative micrographs show MitoSox staining in different groups, as indicated. Arrow indicates positive staining. Cells cultured on coverships were stained with MitoSox. Scale bar, 25 μm. P and Q Representative western blot (P) and graphical representations of BCL2, BAX, and cleaved caspase 3 protein expression levels are shown. *P < 0.05, **P < 0.01 versus pcDNA3 group; #P < 0.05; ##P < 0.01 versus H/R with pcDNA3 group (n = 3).
Fig. 8
Fig. 8. CD44 induces tubular cell injury through MAPK-NF-κB p65-silenced PGC-1α signaling.
A and B HKC-8 was transfected with pcDNA3 or p-Flag-p65 overexpression plasmid for 24 h. Representative western blot (A) and graphical presentations of PGC-1α, CPT1a, BCL2, and cleaved caspase 3 protein expression levels are shown. *P < 0.05, **P < 0.01, ***P < 0.001 versus pcDNA3 groups (n = 3). C Quantitative PCR result showing relative mRNA level of PGC-1α. *P < 0.05 versus pcDNA3 groups (n = 3). D Representative ChIP assay results showing the binding of p65 to PGC-1α gene promoter region. HKC-8 cells were transfected with pcDNA3 or p-Flag-p65 for 24 h. Cell lysates were precipitated with an antibody against p65, histone H3, or nonimmune IgG, and ChIP assay was performed for PGC-1α gene promoters. Total diluted lysate was used as total genomic input DNA. E–I HKC-8 was pre-treated with SB203580, PD98059 or PDTC at 1 h before transfection with pcDNA3 or p-HA-CD44 plasmid for 24 h. Representative western blot (E) and graphical presentations of F p-p38/p38, G p-ERK1/2/ERK1/2, H p-p65, and I PGC-1α protein expression levels are shown. **P < 0.01, ***P < 0.001 versus pcDNA3 group; #P < 0.05, ##P < 0.01 versus pHA-CD44 group; ††P < 0.01, †††P < 0.001 versus pHA-CD44 group; φφφP < 0.001 versus pHA-CD44 group (n = 3). J The heatmap exhibiting differentiated lipids of lipidomics sequencing between H/R with Crtl-shR group and H/R with CD44-shR group.
Fig. 9
Fig. 9. CD44 promotes tubular cell injury and AKI partially through ferroptosis.
A HKC-8 was transfected with Ctrl-shR or CD44-shR plasmid and then treated with 5 μM erastin for 24 h. Representative micrographs show the Fe2+ content via FerroOrange staining in different groups, as indicated. Scale bar, 25 μm. B and C Quantitative results of QPCR showing relative (B) GPX4 and (C) ACSL4 mRNA levels among different groups. **P < 0.01 versus Ctrl-shR group; #P < 0.05 versus erastin with ctrl-shR (n = 3). D HKC-8 was transfected with pcDNA3 or pHA-CD44 overexpression plasmid and then treated with 5 μM erastin for 24 h. Representative micrographs show the Fe2+ content via FerroOrange staining in different groups, as indicated. Scale bar, 25 μm. E and F Quantitative result of QPCR showing relative (E) GPX4 and (F) ACSL4 mRNA levels among different groups. ***P < 0.001 versus pcDNA3 group; #P < 0.05 versus erastin with pcDNA3 (n = 3). G Representative micrographs show the Fe2+ content via FerroOrange staining in different groups, as indicated. Scale bar, 25 μm. H and I Quantitative result of QPCR showing relative H GPX4 and I ACSL4 mRNA level among different groups. ***P < 0.001 versus Ctrl-shR group; ##P < 0.01, ###P < 0.001 versus H/R with ctrl-shR (n = 3). J Quantitative result showing MDA content among different groups. ***P < 0.001 versus Ctrl-shR group; #P < 0.05 versus H/R with ctrl-shR (n = 3). K and L Quantitative result of QPCR showing relative (K) GPX4 and (L) ACSL4 mRNA levels among different groups. ***P < 0.001 versus pcDNA3 group; #P < 0.05 versus H/R with pcDNA3 (n = 3). M Quantitative result showing MDA content among different groups. ***P < 0.001 versus pcDNA3 group; #P < 0.05 versus H/R with pcDNA3 (n = 3). N Representative micrographs show the Fe2+ content via FerroOrange staining in different groups, as indicated. Scale bar, 25 μm. O Quantitative result showing total iron content in kidney tissue among different groups. ***P < 0.001 versus wild-type mice upon sham group; ##P < 0.01 versus wild-type mice upon IRI group (n = 5). P and Q Quantitative result of QPCR showing relative P GPX4 and Q ACSL4 mRNA levels among different groups. **P < 0.01, ***P < 0.001 versus wild-type mice upon sham group; #P < 0.05, ##P < 0.01 versus wild-type mice upon IRI group (n = 5). R Quantitative result showing MDA content in kidney tissue among different groups. **P < 0.01 versus wild-type mice upon sham group; #P < 0.05 versus wild-type mice upon IRI group (n = 5). S Quantitative result showing total iron content in kidney tissue among different groups. ***P < 0.001 versus sham group; ##P < 0.01 versus IRI group injected with pcDNA3 (n = 5). T and U Quantitative result of QPCR showing relative S GPX4 and T ACSL4 mRNA level among different groups. ***P < 0.001 versus sham group; #P < 0.05 versus IRI group injected with pcDNA3 (n = 5). V Quantitative result showing MDA content in kidney tissue among different groups. ***P < 0.001 versus sham group; ###P < 0.001 versus IRI group injected with pcDNA3 (n = 5).
Fig. 10
Fig. 10. Schematic diagram.
CD44 plays an important role in the pathogenesis of AKI. Through the activation of MAPK and NF-κB p65, CD44 inhibits PGC-1α transcription and subsequent binding of PGC-1α and PPARα. This leads to FAO deficiency and loss of mitochondrial biogenesis, causing lipid accumulation and mitochondrial dysfunction. Concomitantly, Bax migrates to the outer membrane of mitochondria and drives high permeability in mitochondria, resulting in the release of cytochrome c into cytoplasm. Cytochrome c then binds with apoptosis-protease-activating factor 1 (APAF1), inducing the activation cascade of caspases, such as caspase 9 and caspase 3, which finally drives tubular cellular apoptosis and initiates AKI. Additionally, CD44 also facilitates endolysosomes to uptake Fe3+ and endosomal transferring to Fe2+. Through Fenton reaction, Fe2+ promotes the production of ROS to aggravate lipid peroxidation. Some Fe2+ can also transfer into mitochondria via open channels such as mitochondrial permeability transition pore. In mitochondria, Fe2+ could also assist mitochondrial ROS production via Fenton reaction. The release of mitochondrial ROS further exaggerates the production of lipid peroxidation, which promotes ferroptosis in tubular cells and assists AKI progression.

Similar articles

References

    1. Singbartl K, Kellum JA. AKI in the ICU: definition, epidemiology, risk stratification, and outcomes. Kidney Int. 2012;81:819–25. - PubMed
    1. Miao J, Huang J, Liang Y, Zhang Y, Li J, Meng P, et al. Sirtuin 6 is a key contributor to gender differences in acute kidney injury. Cell Death Discov. 2023;9:134. - PMC - PubMed
    1. Chen TH, Liu CT, Cheng CY, Sue YM, Huang NJ, Chen CH. Oligosaccharides ameliorate acute kidney injury by alleviating cluster of differentiation 44-mediated immune responses in renal tubular cells. Nutrients. 2022;14:760. - PMC - PubMed
    1. Livingston MJ, Shu S, Fan Y, Li Z, Jiao Q, Yin XM, et al. Tubular cells produce FGF2 via autophagy after acute kidney injury leading to fibroblast activation and renal fibrosis. Autophagy. 2023;19:256–77. - PMC - PubMed
    1. Chung KW, Lee EK, Lee MK, Oh GT, Yu BP, Chung HY. Impairment of PPARα and the fatty acid oxidation pathway aggravates renal fibrosis during aging. J Am Soc Nephrol. 2018;29:1223–37. - PMC - PubMed

MeSH terms

Substances

LinkOut - more resources