. 2025 Feb 20;16(1):1827.
doi: 10.1038/s41467-025-57071-7.

Ameba-inspired strategy enhances probiotic efficacy via prebound nutrient supply

Affiliations

Ameba-inspired strategy enhances probiotic efficacy via prebound nutrient supply

Chao Pan et al. Nat Commun. .

Abstract

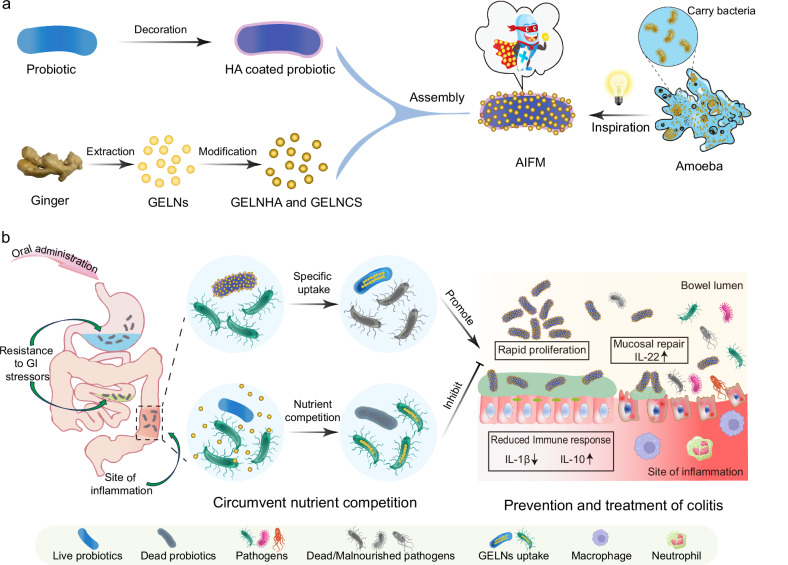
Nutrient competition with indigenous microbes or pathogens presents a significant challenge for oral probiotic efficacy. To address this issue, we develop an ameba-inspired food-carrying strategy (AIFS) by prebinding ginger-derived exosome-like nanoparticles (GELNs) onto probiotics as food depots. AIFS enables probiotics to efficiently and exclusively consume GELNs in situ, even in the presence of competing bacteria. This results in up to 21 times higher uptake efficiency compared to unengineered probiotics, dramatically accelerating probiotic proliferation. Meanwhile, AIFS potentiates probiotics' resistance to multiple GI stressors. In a murine model of colitis, AIFS can improve the abundance of probiotics and inhibit pathogens, maintaining intestinal flora homeostasis. Additionally, it can upregulate the anti-inflammatory IL-10, reduce the proinflammatory IL-1β, and repair damaged intestinal mucus. Thereby, AIFS displays potently elevated prophylactic and therapeutic efficacy for colitis mice. This work provides a method for microbial engineering, with broad implications for microbiotherapy and gut health.


Conflict of interest statement

Competing interests: The authors declare no competing interests.

Figures

Fig. 1
Fig. 1. Schematic illustration of the fabrication and function of AIFM.
a Fabrication of AIFM. Probiotics were coated with HA via amidation. GELNs were decorated with HA and CS via amidation and electrostatic interaction, respectively. Then, HA/CS-engineered GELNs were sequentially assembled onto HA-modified probiotic surfaces via electrostatic interaction and amidation. b Function of AIFM. AIFM can assist probiotics in avoiding nutrient competition with indigenous microbes or pathogens through specific uptake of prebound GELNs by probiotics in the gut for enhanced survival, proliferation, and colonization. The colonized probiotics can restore intestinal flora homeostasis, repair damaged intestinal mucus, and reduce inflammatory immune responses, thereby preventing and alleviating colitis.
Fig. 2
Fig. 2. Surface engineering of GELNs and probiotics.
ad Characterization of GELNs, GELNHA, and GELNCS. a Representative TEM image of GELNs. Scale bar, 100 nm. b Representative images of sodium dodecyl sulfate-polyacrylamide gel electrophoresis (SDS-PAGE) protein analysis of ginger tissues and GELNs. c Representative cryo-TEM images of GELNs, GELNHA, and GELNCS. The yellow arrow points to the wall of the GELNs. Scale bar, 50 nm. d Representative CLSM images of GELNHA and GELNCS, HA was labeled with 5-aminofluorescein, and CS was conjugated with rhodamine B. Scale bar, 2 μm. eh Characterization of probiotics decorated with HA. e Representative CLSM images of native and HA-modified probiotics. LGG were stained with Nile red, EcN carried pBBR1MCS2-Tac-mCherry. HA was labeled with 5-aminofluorescein. Scale bar, 2 μm. f Flow cytometry histograms of probiotics before and after decoration with HA. g Mean fluorescence intensity (MFI) of native and HA-decorated probiotics. h Surface zeta potential of LGG, LGGHA, EcN, and EcNHA. i Representative AFM images of LGG and LGGHA and their surface roughness. Data in (gi) were presented as mean ± standard deviation (SD) (n = 3 independent samples). Significance was assessed using a two-tailed Student’s t-test.
Fig. 3
Fig. 3. Prebinding engineered GELNs onto probiotics.
AIFM were prepared by sequentially assembling HA/CS-engineered GELNs onto HA-modified probiotic surfaces via electrostatic interaction and amidation. a Surface potential variations of HA-modified LGG and EcN before and after sequential assemblies of engineered GELNs. b Flow cytometry profile of LGG before and after sequential assemblies of engineered GELNs. GELNs are labeled with Dio. c MFI of LGG, LGG@GELN1, LGG@GELN2, and LGG@GELN determined by flow cytometry. d Cell viability of LGG and LGG@GELN as well as EcN and EcN@GELN measured by CCK-8 kit. e, f Representative confocal images of LGG (e) and EcN (f) prior to assembly with GELNs and following one and three assemblies with GELNs. LGG was stained with Nile red, EcN carried pBBR1MCS2-Tac-mCherry, and GELNs were labeled with Dio. Scale bar, 2 μm. g, h Representative TEM images of LGG@GELN (g) and EcN@GELN (h). Scale bar, 300 nm. i, j Representative AFM images (i) of native probiotics and AIFM and the corresponding surface roughness (j). Data in (a, c, d, j) were presented as mean ± SD (n = 3 independent samples). The differences between the groups were determined using a two-tailed Student’s t-test.
Fig. 4
Fig. 4. In vitro resistance to GI stressors, specific uptake of GELNs, and promotion of probiotic proliferation by AIFS.
ad In vitro resistance of LGG@GELN against environmental assaults. LGG, LGG/GELN, and LGG@GELN containing equal amounts of probiotics were exposed to the following: SGF supplemented with pepsin (pH 2.5) (a), 0.3 mg mL−1 of bile salt (b), 10 mg mL1 lysozyme solution (c), and 3% DSS (d). After incubation for a predetermined time, 100 μL of each sample was washed twice with PBS, spread onto MRS agar plates, and incubated at 37 °C for 48 h before counting. e Representative CLSM images of uptake of GELNs in LGG, LGG/GELN, and LGG@GELN comprising equal amounts of probiotics and GELNs after incubation at 37 °C for 4 h. Scale bar, 3 μm. f CLSM tomography images of LGG@GELN after uptake of GELNs from up, middle, and down fault planes. Blue and red fluorescent signals represent Hoechst 33342-stained probiotics and Dil-labeled GELNs, respectively. Scale bar, 1 μm. g, h Representative flow cytometry curves (g) of bacterial uptake of GELNs for LGG, LGG/GELN, LGGHA/GELN, and LGG@GELN after incubation in PBS for 4 h, and corresponding bar graph (h) of bacterial uptake percent. i, j Representative flow cytometry results (i) of bacterial uptake of GELNs by LGG in the presence of L. reuteri or E.Coli, and a corresponding bar graph (j) of uptake percent after incubation for 10 h. k, l Monitoring probiotic proliferation in the nutrient-exhausted SIF by L.reuteri (k) and E.Coli (l) without the presence of pathogens via recording optical density at 600 nm (OD600) at predetermined time points. m Probiotic growth curves in the nutrient-exhausted SIF with the presence of pathogens. Data in (ad, h, jm) were presented as mean ± SD (n = 3 independent samples). Significance was assessed using a one-way ANOVA test.
Fig. 5
Fig. 5. In vivo retention of GELNs in the GI tract, specific uptake of GELNs, and modulation of gut microbiota.
a, b Evaluation of the retention of GELNs in GI tracts. IVIS images (a) of mouse intestinal tracts after oral gavage of formulations with equal amounts of GELNs for 8 h and corresponding bar graph of fluorescence intensity (b). GELNs were labeled with Dil. c Monitoring probiotic uptake of GELNs in vivo via CLSM. Blue and red fluorescent signals represent Hoechst 33342-stained probiotics and Dil-labeled GELNs, respectively. Scale bar, 5 μm. dn Modulation of the gut microflora by AIFM in mice with colitis (n = 4). d, e β-diversity analysis results of principal coordinate analysis (PCoA) (d) and nonmetric multidimensional scaling (NMDS) (e) of the gut microflora on the genus level. Short distances between groups indicate small differences among groups. f, g Relative abundances of gut microflora on the phylum (f) and genus (g) levels. h Heat map of gut microbiota on the genus level. in Relative abundances of Escherichia-Shigella (i), Helicobacter (j), Romboutsia (k), Lactobacillus (l), Bacillius (m), and Bifidobacterium (n) in the gut microflora. Data in (b, in) were presented as mean ± SD (n = 3 independent samples). Significance was assessed using one-way ANOVA.
Fig. 6
Fig. 6. Enhanced therapeutic efficacy by AIFS in a DSS-induced murine model of colitis.
a Experimental design for treatment. Mice were fed with 3% DSS for 7 days to develop colitis and then daily administered with formulations containing equivalent LGG (5 × 108 CFUs) by oral gavage for another 7 days. The intestinal tracts of mice were harvested 7 days post-treatment for histopathological and ELISA analysis. b Digital photos of the harvested intestinal tracts after the final treatment. c, d Changes of mouse bodyweight (c) during the induction and treatment of colitis and final bodyweight (d) on day 14. e Length of mouse intestinal tracts at the end of treatment. f, h The concentrations of cytokines in colon tissues determined by ELISA. Levels of IL-1β (f), IL-10 (g), and IL-22 (h) in colon tissues harvested at the end of treatment. i Histopathological analysis via H&E staining of the colon after treatment. The blue arrows indicate inflammation, and the red arrows refer to epithelial injury. Scale bar, 200 μm. j Myeloperoxidase staining of the colon after treatment. Scale bar, 150 μm. k Immunofluorescence images by CLSM for mucosal repair assessment. The mucoprotein in mucus was immunofluorescently labeled by Alexa Fluor 488. The cell nucleus was labeled with DAPI. Scale bar, 250 μm. Data in (ch) were presented as mean ± SD (n = 4 independent samples). Significance was assessed using one-way ANOVA.
Fig. 7
Fig. 7. Improved prophylactic potency by AIFS in DSS-induced murine model of colitis.
a Experimental design for colitis prevention (n = 5). Mice were administered with formulations containing equal amounts of 5 × 108 CFUs of probiotics daily by oral gavage for 10 days. Mice were fed with 3% DSS starting on day 4 and maintained for 7 days. Healthy mice were used as a control. The intestinal tracts of mice were harvested on day 11 for histopathological and ELISA analysis. b Digital photos of the harvested intestinal tracts. c Variation of bodyweight of mice during colitis occurrence and treatment. d, Length of the intestinal tract after treatment. e Final bodyweight of mice on day 14. fh The concentrations of relevant cytokines in colon tissues measured by ELISA. Levels of IL-1β (f), IL-10 (g), and IL-22 (h) in colon tissues collected after the final treatment. i Typical images of H&E staining of the colon after treatment. The blue and red arrows indicate inflammation and epithelial injury, respectively. Scale bar, 100 μm. j Representative images of myeloperoxidase staining of the colon after treatment. Scale bar, 100 μm. Data in (ch) were presented as mean ± SD (n = 5 independent samples). Significance was assessed using one-way ANOVA.

References

    1. Li, C., Wang, Z. X., Xiao, H. & Wu, F. G. Intestinal delivery of probiotics: materials, strategies, and applications. Adv. Mater. e2310174 (2024). - PubMed
    1. Chudy-Onwugaje, K. O., Christian, K. E., Farraye, F. A. & Cross, R. K. A state-of-the-art review of new and emerging therapies for the treatment of IBD. Inflamm. Bowel Dis.25, 820–830 (2018). - PMC - PubMed
    1. Cao, F. et al. Artificial-enzymes-armed bifidobacterium longum probiotics for alleviating intestinal inflammation and microbiota dysbiosis. Nat. Nanotechnol.18, 617–627 (2023). - PubMed
    1. Rook, G. et al. Evolution, human-microbe interactions, and life history plasticity. Lancet390, 521–530 (2017). - PubMed
    1. Ashida, H. et al. Bacteria and host interactions in the gut epithelial barrier. Nat. Chem. Biol.8, 36–45 (2012). - PubMed

LinkOut - more resources