

High WEE1 expression is independently linked to poor survival in multiple myeloma
- PMID: 39979284
- PMCID: PMC11842801
- DOI: 10.1038/s41408-025-01230-y
High WEE1 expression is independently linked to poor survival in multiple myeloma
Abstract
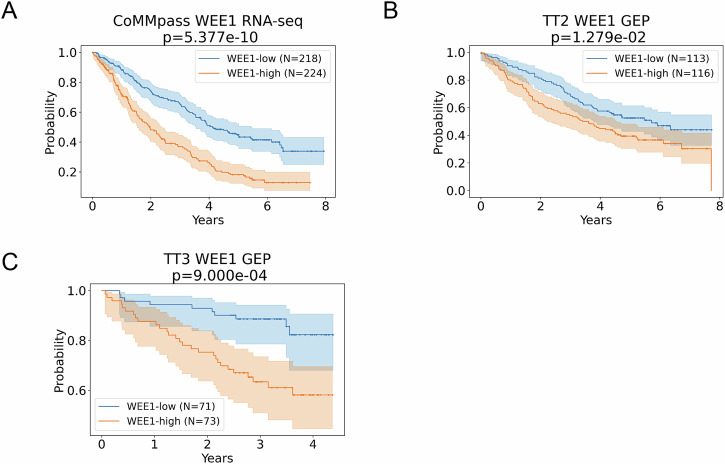
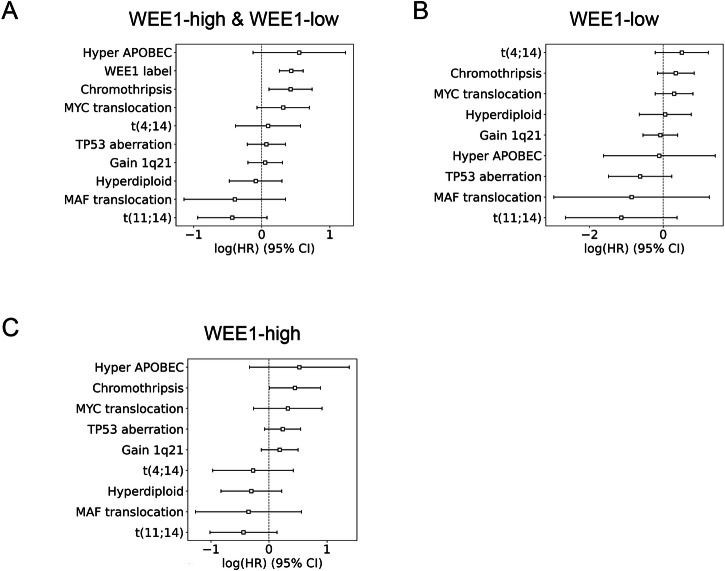
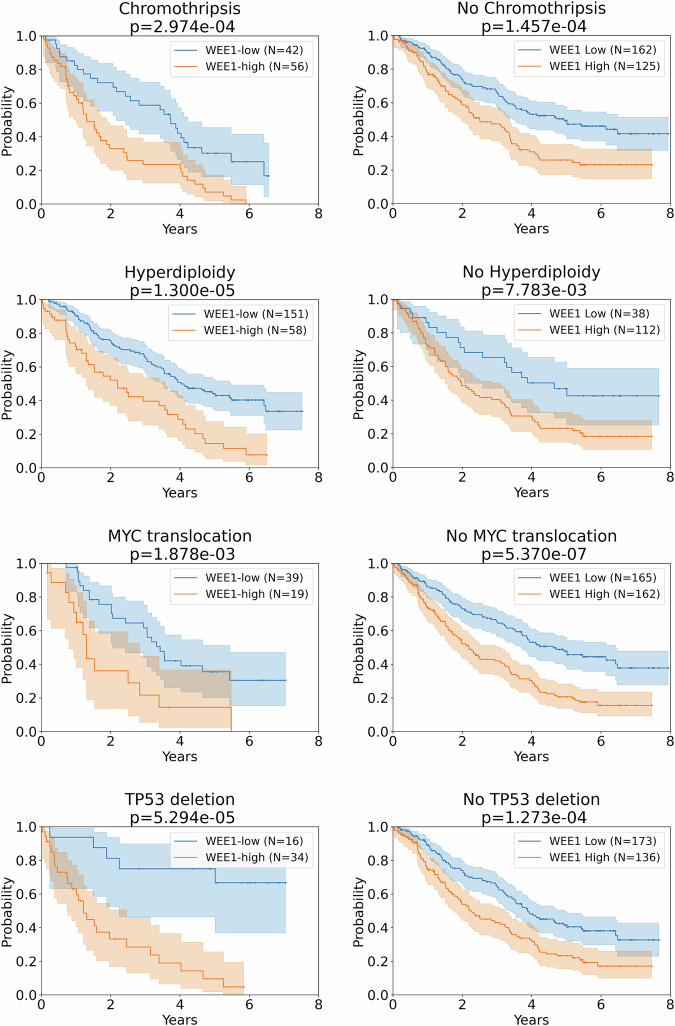
Current prognostic scores in multiple myeloma (MM) currently rely on disease burden and a limited set of genomic alterations. Some studies have suggested gene expression panels may predict clinical outcomes, but none are presently utilized in clinical practice. The tyrosine kinase WEE1 is a critical cell cycle regulator during the S-phase and G2M checkpoint. Abnormal WEE1 expression has been implicated in multiple cancers including breast, ovarian, and gastric cancers, but its prognostic signal in MM has not been thoroughly reported. We, therefore, analyzed the MMRF CoMMpass dataset (N = 659) and identified a high-risk group (top tertile) and a low-risk group (bottom tertile) based on WEE1 expression sorted in descending order. PFS was significantly different (p < 1e-9) between the groups, which was validated in two independent microarray gene expression profiling (GEP) datasets from the Total Therapy 2 (N = 341) and 3 (N = 214) trials. Our results show that WEE1 expression is prognostic independent of known biomarkers, differentiates outcomes associated with known markers, is upregulated independently of its interacting neighbors, and is associated with dysregulated P53 pathways. This suggests that WEE1 expression levels may have clinical utility in prognosticating outcomes in newly diagnosed MM and may support the application of WEE1 inhibitors to MM preclinical models. Determining the causes of abnormal WEE1 expression may uncover novel therapeutic pathways.
© 2025. The Author(s).
Conflict of interest statement
Competing interests: SZU: research funding: Amgen, BMS/Celgene, GSK, Janssen, Merck, Pharmacyclics, Sanofi, Seattle Genetics, Takeda. Consulting/Advisory Board: AbbVie, Amgen, BMS, Celgene, Genentech, Gilead, GSK, Janssen, Sanofi, Seattle Genetics, SecuraBio, SkylineDX, Takeda, TeneoBio.
Figures


Update of
-
High WEE1 expression is independently linked to poor survival in multiple myeloma.bioRxiv [Preprint]. 2024 Sep 24:2024.09.20.613788. doi: 10.1101/2024.09.20.613788. bioRxiv. 2024. Update in: Blood Cancer J. 2025 Feb 20;15(1):22. doi: 10.1038/s41408-025-01230-y. PMID: 39386721 Free PMC article. Updated. Preprint.
References
-
- Gutiérrez NC, Sarasquete ME, Misiewicz-Krzeminska I, Delgado M, De Las Rivas J, Ticona FV, et al. Deregulation of microRNA expression in the different genetic subtypes of multiple myeloma and correlation with gene expression profiling. Leukemia. 2010;24:629–37. - PubMed
Publication types
MeSH terms
Substances
Grants and funding
LinkOut - more resources
Full Text Sources
Medical
Research Materials
Miscellaneous
