. 2025 Feb 20;16(1):1829.
doi: 10.1038/s41467-025-56979-4.

Bacteria invade the brain following intracortical microelectrode implantation, inducing gut-brain axis disruption and contributing to reduced microelectrode performance

Affiliations

Bacteria invade the brain following intracortical microelectrode implantation, inducing gut-brain axis disruption and contributing to reduced microelectrode performance

George F Hoeferlin et al. Nat Commun. .

Abstract

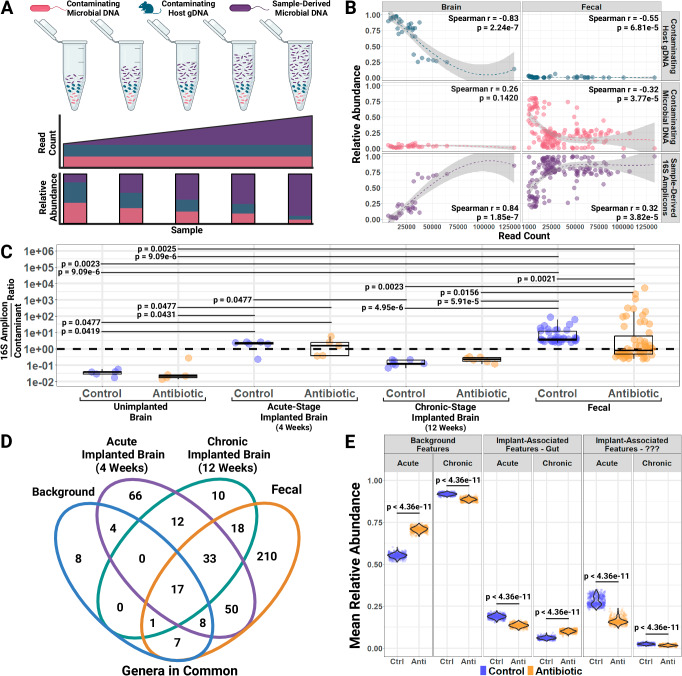
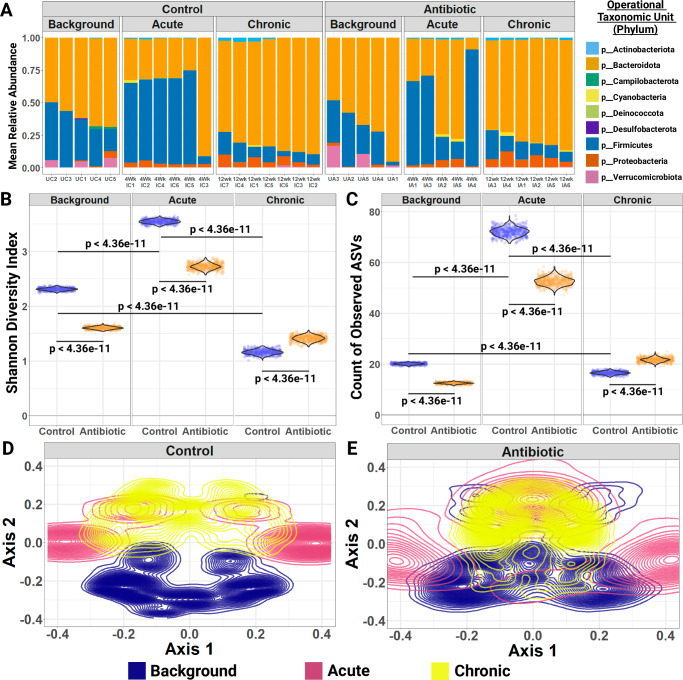
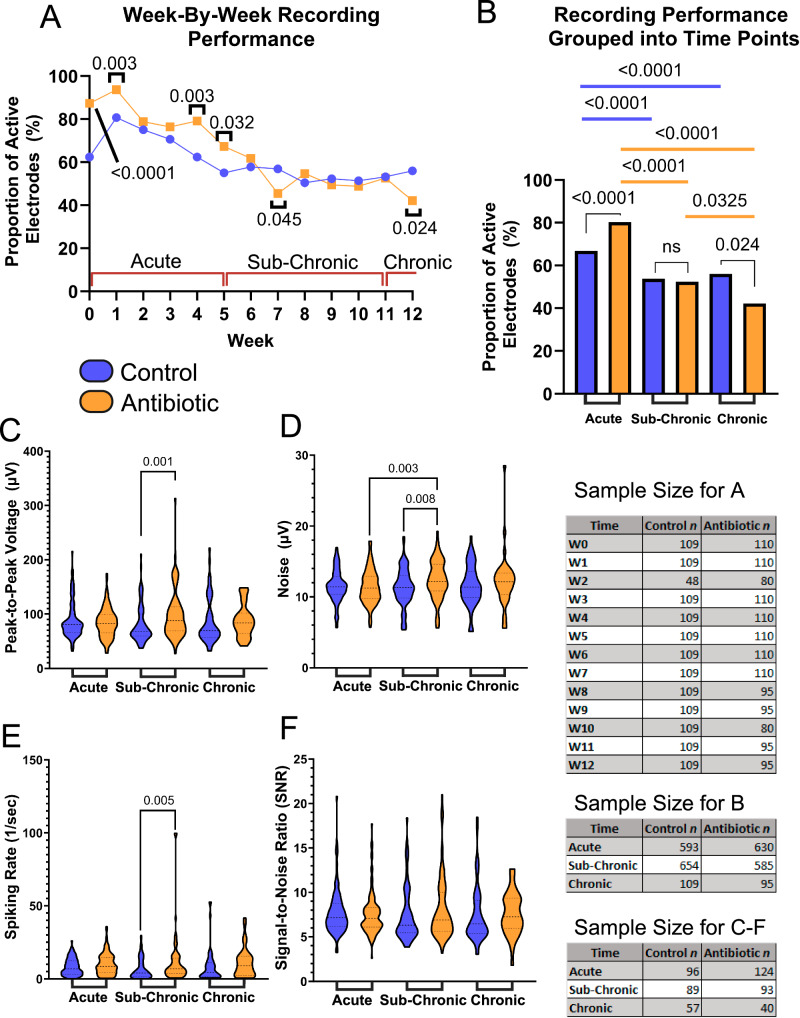
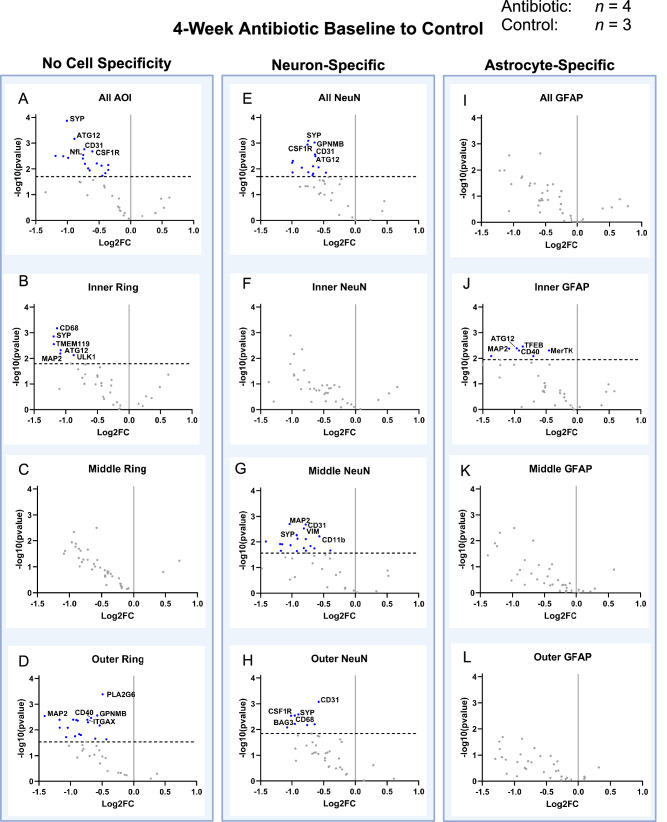
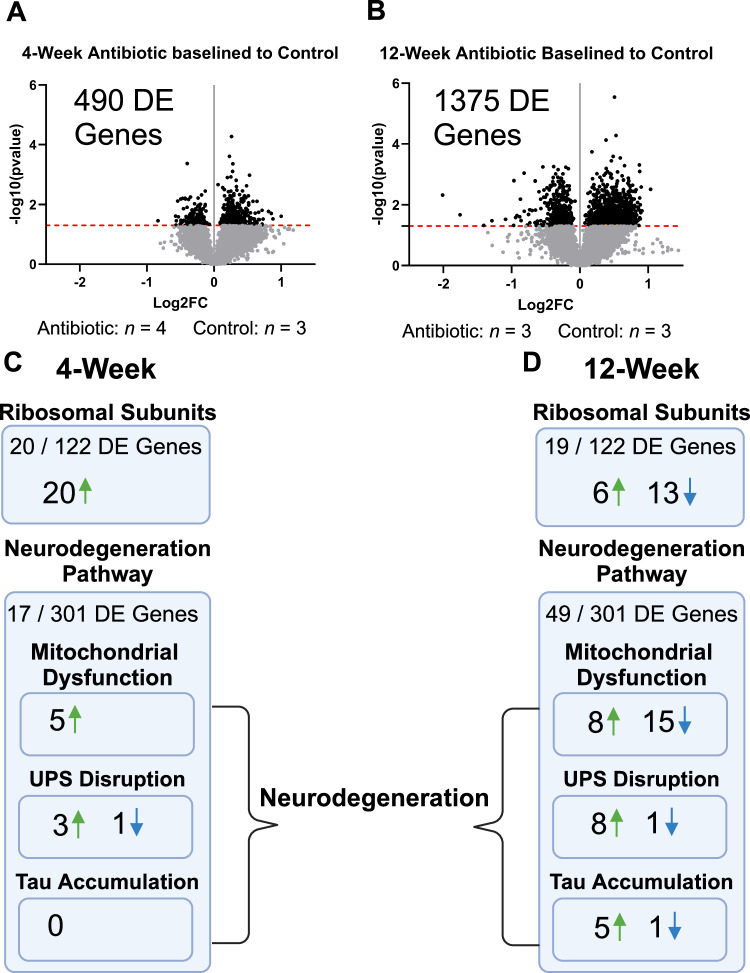
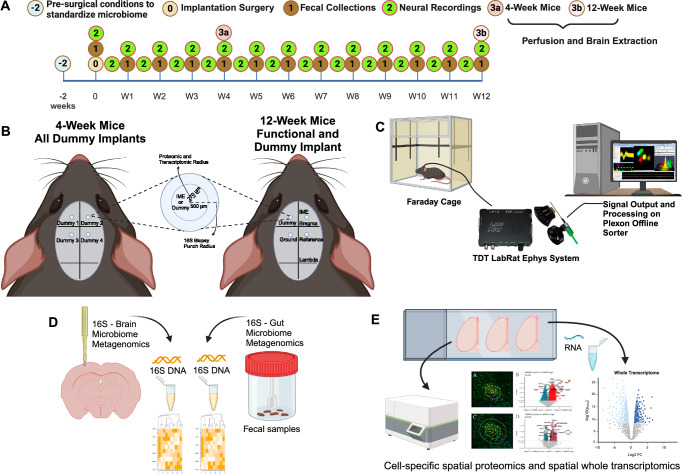
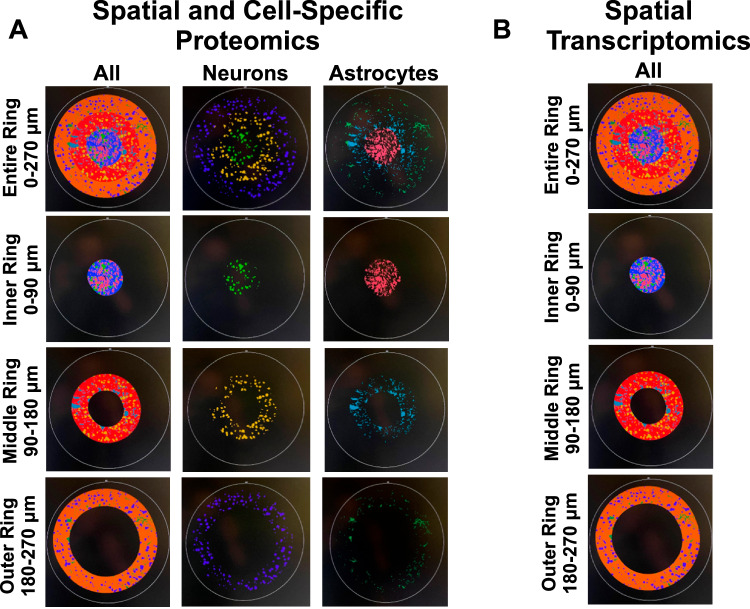
Brain-machine interface performance can be affected by neuroinflammatory responses due to blood-brain barrier (BBB) damage following intracortical microelectrode implantation. Recent findings suggest that certain gut bacterial constituents might enter the brain through damaged BBB. Therefore, we hypothesized that damage to the BBB caused by microelectrode implantation could facilitate microbiome entry into the brain. In our study, we found bacterial sequences, including gut-related ones, in the brains of mice with implanted microelectrodes. These sequences changed over time. Mice treated with antibiotics showed a reduced presence of these bacteria and had a different inflammatory response, which temporarily improved microelectrode recording performance. However, long-term antibiotic use worsened performance and disrupted neurodegenerative pathways. Many bacterial sequences found were not present in the gut or in unimplanted brains. Together, the current study established a paradigm-shifting mechanism that may contribute to chronic intracortical microelectrode recording performance and affect overall brain health following intracortical microelectrode implantation.


Conflict of interest statement

Competing interests: The contents do not represent the views of the U.S. Department of Veterans Affairs, the National Institutes of Health, or the United States Government. The authors declare no conflict of interest.

Figures

Fig. 1
Fig. 1. Systemic antibiotic treatment associated with fewer distinct bacterial features in brain following intracortical microelectrode implantation.
Biological replicate sample sizes: unimplanted control brain (n = 5), unimplanted antibiotic brain (n = 5), acute implanted control brain (n = 6), acute implanted antibiotic brain (n = 5), chronic implanted control brain (n = 7), chronic implanted antibiotic brain (n = 6), baseline fecal (n = 38), antibiotic fecal (n = 55). A Schematic of relationship between technical contaminants and sample-derived bacterial sequences in microbiome studies. B Scatterplots, Locally Estimated Scatterplot Smoothing (LOESS) regressions, and Spearman correlations of total read count versus relative abundance of contaminating host gDNA, contaminating microbial DNA, and sample-derived 16S amplicons for brain tissues and fecal samples. LOESS curve shading indicates 95% confidence for local weighted least-squares fit, and Spearman correlation p-values are 2-sided. C Boxplots with raw data points for the ratio of 16S amplicon reads to contaminant reads for untreated control and antibiotic-treated brain tissues versus untreated baseline and antibiotic-treated fecal samples. Whisker length is 1.5x the interquartile region, lower box boundary the 1st quartile, center line the median, and upper box boundary the 3rd quartile. Pairwise comparisons were made using a 2-sided Dunn test and Benjamini-Hochberg correction for multiple comparisons. D Total genera observed in background, acute and chronic brains, or fecal samples. E Violin plots over raw data points of mean relative abundance in rarified implanted brain samples of bacterial features shared by background samples or which were implantation-associated, subdivided by whether sequences were also observed in the fecal samples or of unknown anatomical origin. 500 rarefactions performed and pairwise comparisons made using 2-sided Tukey’s Honest Significant Differences with adjustment for multiple comparisons. Created in BioRender. Capadona, J. (2025) https://BioRender.com/g57h879.
Fig. 2
Fig. 2. Intracortical microelectrode implantation affects the composition of bacterial sequences extracted from brain tissues, and compositional shifts are reduced in antibiotic-treated animals.
Short-term and long-term changes in 16S sequence prevalence and abundance were observed following IME implantation, which were mitigated by systemic antibiotic treatment. Biological replicate sample sizes: unimplanted control brain (n = 5), unimplanted antibiotic brain (n = 5), acute implanted control brain (n = 6), acute implanted antibiotic brain (n = 5), chronic implanted control brain (n = 7), chronic implanted antibiotic brain (n = 6). A Bar plots of the mean relative abundance of bacterial sequences by sample and phylum from 500 rarefactions. B Violin plots over raw data points of the mean Shannon Diversity Index in rarefied samples. 500 rarefactions performed and pairwise comparisons made using 2-sided Tukey’s Honest Significant Differences with multiple comparisons adjustment. C Violin plots over raw data points of the mean number of observed ASVs in rarefied samples. 500 rarefactions performed and pairwise comparisons made using 2-sided Tukey’s Honest Significant Differences with multiple comparisons adjustment. D Density contour plot of implanted brain and background samples of the untreated control cohort ordinated by Principal Components Analysis (PCoA) on rarefied samples using the unweighted UniFrac distance with 2-sided PERMANOVA test with the Benjamini-Hochberg correction for multiple testing. 10,000 permutations used in the analysis of 500 rarefactions, with the largest adjusted PERMANOVA p-value being p = 0.0025. E Density contour plot of implanted brain and background samples of the antibiotic-treated cohort ordinated by Principal Components Analysis (PCoA) on rarefied samples using the unweighted UniFrac distance with PERMANOVA test. 10,000 permutations used in the analysis of 500 rarefactions, with the smallest unadjusted PERMANOVA p-value being p = 0.2668. Created in BioRender. Capadona, J. (2025) https://BioRender.com/c43l764.
Fig. 3
Fig. 3. Antibiotic Treatment Significantly Improves the Recording Performance of Intracortical Microelectrodes.
Neurophysiological recordings to evaluate the performance of our intracortical microelectrodes and the impact of antibiotic treatment compared to control. Blue indicates control while orange indicates antibiotic groups. Comparisons are made to evaluate A the week-by-week proportion of active electrodes and B the acute, sub-chronic, and chronic grouped proportion of active electrodes. Additional metrics were evaluated to measure the C peak-to-peak voltage (Vpp), D root-mean-squared of the noise, E spike-rate of the single units, and F signal-to-noise ratio (SNR) of all active channels. The sample size for all comparisons is included as well. A one-tailed proportions z-test was used for calculating statistical differences in the proportion of active electrodes within and across groups for the acute, sub-chronic, and chronic phases. Peak-to-peak voltage, noise, spiking rate, and signal-to-noise ratio were compared within and across acute, sub-chronic, and chronic neuroinflammatory phases using a Kruskal-Wallis test followed by a Benjamini–Krieger–Yekutieli test to adjust for multiple comparisons for non-normal distributions to increase statistical power and reduce type I errors. Statistically significant p-values are displayed in the figure. No symbol or the abbreviation “ns” indicates a lack of statistical significance. No comparisons were made between antibiotic and control at differing time points. Created in BioRender. Capadona, J. (2025) https://BioRender.com/p93j360.
Fig. 4
Fig. 4. Spatial proteomic response is treatment dependent at 4-Weeks post-implantation.
Volcano plots showing neural proteomic panel evaluation of 4-week antibiotic (n = 4) compared to 4-week control (n = 3) across the entire AOI (within 270 μm from the implant), the inner ring of the AOI (within 0–90 μm), the middle ring of the AOI (90–180 μm), and the outer ring (180–270 μm) for all cells, all neuron-specific cells (stained using an NeuN antibody), and all astrocyte-specific cells (stained using a GFAP antibody). Proteins with a negative Log2FC indicate downregulation (blue points) in antibiotic compared to control, while a positive Log2FC indicates upregulation (green points) in antibiotic compared to control. Unadjusted p-values are plotted and shown, but all statistical comparisons were done using adjusted p-values. The black dotted line indicates significance (padjusted = 0.05). Each point on the volcano plot indicates a singular protein, with select proteins shown in the text. Comparisons with no cell specificity were made on the A entire AOI, B inner ring, C middle ring, and D outer ring. Neuron-specific comparisons were made on the E entire AOI, F inner ring, G middle ring, and H outer ring. Astrocyte-specific comparisons were made on the I entire AOI, J inner ring, K middle ring, and L outer ring. After normalization, an unpaired t-test was performed across respective groups for comparison. Unadjusted p-values were corrected using the Benjamini-Hochberg false discovery rate method to account for random significance. A few insignificant proteins were excluded from the plots due to high log2FC values, causing skewing and making visual representation difficult. Five significantly differentially expressed proteins were labeled due to space. Refer to Table 2 for the full list of significantly differentially expressed proteins. Created in BioRender. Capadona, J. (2025) https://BioRender.com/p93j360.
Fig. 5
Fig. 5. Spatial transcriptomics reveals treatment- and time-dependent effects after implantation.
Transcriptomic data composing the full AOI of the implant site (within 270 µm from the implant site). Volcano plots are shown evaluating gene expression at 4- and 12-weeks post-implantation. Unadjusted p-values are plotted and shown. The black dotted line indicates significance (pvalue = 0.05). Each point on the volcano plot indicates a singular gene. There were A 490 differentially expressed (DE) genes at the 4-week time point between antibiotic and control, which increased to B 1375 DE genes at the 12-week time point. Some pathways of note that were impacted by the antibiotic treatment at C 4-weeks post-implantation include the ribosomal subunit structure and neurodegeneration pathways, with changes occurring temporally as seen D in the 12-week time point. Each gene’s raw data / count underwent Q3 normalization followed by statistical analysis using a custom MATLAB R2021a script to perform unpaired t-tests between samples. Unadjusted p-values were used for all further comparisons in the iPathways software suite. At 4-weeks post-implantation, n = 4 for antibiotic-treated and n = 3 for control, and at 12-weeks post-implantation, n = 3 for antibiotic-treated and n = 3 for control. Created in BioRender. Capadona, J. (2025) https://BioRender.com/p93j360.
Fig. 6
Fig. 6. Experimental design outlining the timeline for each cohort.
A The unimplanted mice were sacrificed two weeks after housing separation for analysis. The 4- and 12-week post-implantation animals undergo implantation, fecal collection, neural recordings, and perfusion at their endpoint. B The 4-week cohort received four non-functional dummy implants and the 12-week cohort received one non-functional dummy implant and one functional intracortical microelectrode (IME) implant with respective ground and reference wires. C 12-week functional implanted mice were recorded using a commutator hooked up to the TDT LabRat Ephys system. D 16S analysis was done on a biopsy of brain tissue around the implant site and on fresh fecal matter collected from each animal. E Cell-specific spatial proteomics and spatial transcriptomics were performed on various brain samples sectioned onto microscope slides. Created in BioRender. Capadona, J. (2025) https://BioRender.com/p93j360.
Fig. 7
Fig. 7. Spatial and Cell-Specific Analysis of the Implant Site Using Proteomics and Transcriptomics.
A Proteomics analysis was performed on the entire implant ring (0–270 µm from the implant site), inner ring (0–90 µm from the implant site), middle ring (90–180 µm from the implant site), and outer ring (180–270 µm from the implant site) on a cell-specific basis for neurons, astrocytes, and all cells. B Transcriptomic analysis was not done using cell-specificity. Only spatial separation to analyze the implant regions was performed. Created in BioRender. Capadona, J. (2025) https://BioRender.com/p93j360.

Update of

Similar articles

References

    1. Bullard, A. J., Hutchison, B. C., Lee, J., Chestek, C. A. & Patil, P. G. Estimating risk for future intracranial, fully implanted, modular neuroprosthetic systems: a systematic review of hardware complications in clinical deep brain stimulation and experimental human intracortical arrays. Neuromodulation23, 411–426 (2020). - PubMed
    1. Ajiboye, A. B. et al. Restoration of reaching and grasping movements through brain-controlled muscle stimulation in a person with tetraplegia: a proof-of-concept demonstration. Lancet398, 1821–1830 (2017). - PMC - PubMed
    1. Barrese, J. C. et al. Failure mode analysis of silicon-based intracortical microelectrode arrays in non-human primates. J. Neural Eng.10, 066014 (2013). - PMC - PubMed
    1. Jorfi, M., Skousen, J. L., Weder, C. & Capadona, J. R. Progress towards biocompatible intracortical microelectrodes for neural interfacing applications. J. Neural Eng.12, 011001 (2015). - PMC - PubMed
    1. Biran, R., Martin, D. C. & Tresco, P. A. Neuronal cell loss accompanies the brain tissue response to chronically implanted silicon microelectrode arrays. Exp. Neurol.195, 115–126 (2005). - PubMed

Substances

LinkOut - more resources