. 2025 Feb 20;15(1):6189.
doi: 10.1038/s41598-025-90936-x.

Side dominance and eye patches obscuring half of the visual field do not affect walking kinematics

Affiliations

Side dominance and eye patches obscuring half of the visual field do not affect walking kinematics

János Négyesi et al. Sci Rep. .

Abstract

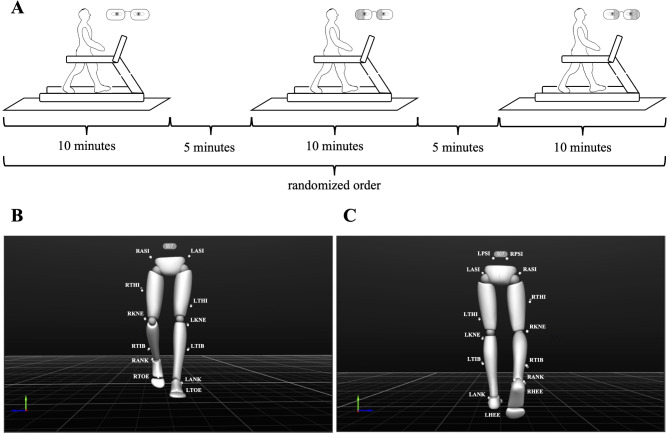
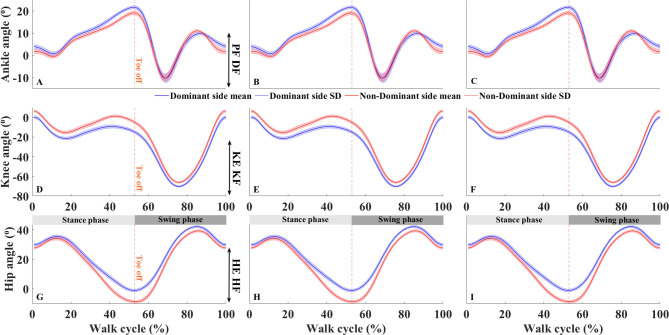
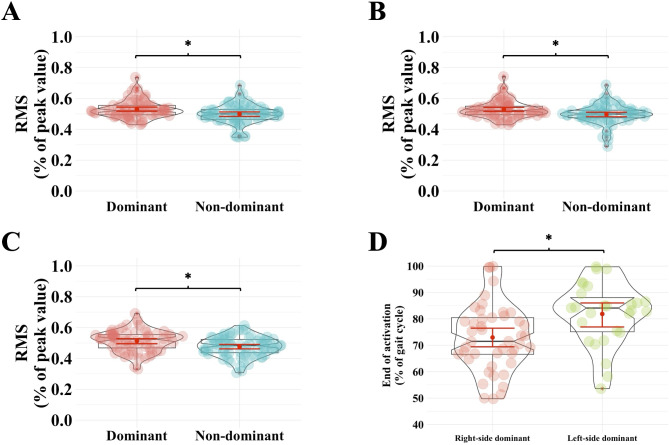
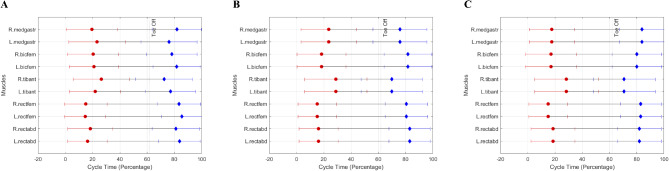
Vision plays a fundamental role in the control of human locomotion, including walking gait. Given that side-dominance is associated with differences in motor control, the present study aimed to determine if patches obscuring half of the visual field affect left- and right-side dominant individuals' gait kinematics and accompanying leg muscle activation differently. Healthy right- (n = 15, age = 28.2 ± 5.5 years) and left-side (n = 9, age = 27.9 ± 5.8 years) dominant participants performed 10 min of walking trials on a treadmill at a self-selected speed with 5 min of rest between three randomized trials, i.e., wearing clear glasses or glasses with left-or right half-field eye patching. In addition to a set of spatiotemporal and kinematic gait parameters, the average activity during the separated gait cycle phases, and the start and end of muscle activation in % of the gait cycle were calculated from five muscles in three muscle groups. Our results indicate that gait kinematics of left- and right-side dominant participants were similar both in their dominant and non-dominant legs, regardless of half-field eye patching condition. On the other hand, inter-group differences were found in selected kinematic variables. For instance, in addition to larger but less variable step width, our results suggest larger ankle and knee ROM in right- vs. left-sided participants. Furthermore, medial gastrocnemius and biceps femoris muscle activation showed selected differences at certain phases of the gait cycle between participants' dominant and non-dominant legs. However, it was also unaffected by the half-field eye patching condition. Moreover, the endpoint of medial gastrocnemius activation was affected by side-dominance, i.e., its activation ended earlier in the non-dominant leg of right- as compared to left-side dominant participants. Our results suggest no major differences in walking gait kinematics and accompanying muscle activation between half-field eye patching conditions in healthy adults; nevertheless, side-dominance may affect biomechanical and neuromuscular control strategies during walking gait.

Keywords: Electromyography; Gait; Motion capture; Vision; laterality.


Conflict of interest statement

Declarations. Competing interests: The authors declare no competing interests. Conflict of interest: All authors declare that they do not have any conflict of interest. The funders had no role in the design of the study; in the collection, analyses, or interpretation of data; in the writing of the manuscript, or in the decision to publish the results. Word count: 5689 words.

Figures

Fig. 1
Fig. 1
Experimental setup. Panel A: Schematic illustration of the experimental setup. Panel B and C: 3D avatar of a representative subject’s lower limbs and the placement of the reflective markers for motion capture measurements during walking from the front and back sides, respectively. Markers: LANK/RANK: left/right lateral malleolus; LASI/RASI: left/right anterior superior iliac spine; LHEE/RHEE: left/right heel (bisection of the distal aspect of the posterior calcaneum); LKNE/RKNE: left/right knee (lateral epicondyle of the femur); LPSI/RPSI: left/right posterior superior iliac spine; LTHI/RTHI: left/right thigh (not an exact location, only to aid with sides); LTIB/RTIB: left/right shank (not an exact location, only to aid with sides); LTOE/RTOE: left/right toes (between the distal ends of the 1st and 2nd metatarsi).
Fig. 2
Fig. 2
Mean and SD joint angle displacement of the ankle, knee, and hip joints during different walking conditions in a representative participant, for both the dominant and non-dominant legs. Each row represents a different joint: the first row (Subplots A–C) corresponds to the ankle joint, the second row (Subplots D–F) to the knee joint, and the third row (Subplots G–I) to the hip joint. Each column represents different walking conditions: (i) Subplots A, D, and G: show joint displacement during normal vision; (ii) Subplots B, E, and H show joint displacement during left half-field eye patching condition; and (iii) Subplots C, F, and I show joint displacement during the right half-field eye patching condition. The color-matched shaded area is the corresponding SD. Orange vertical dashed lines represent the toe-off instant. PF: plantarflexion, DF: dorsalflexion, KE: knee extension, KF: knee flexion, HE: hip extension, HF: hip flexion.
Fig. 3
Fig. 3
EMG results. Participants had lower medial gastrocnemius RMS values in their non-dominant vs. dominant leg during phase II (Panel A) and IV (Panel B), regardless of group and eye patching condition. Participants had lower biceps femoris RMS values in their non-dominant vs. dominant leg during phase II (Panel C), regardless of group and eye patching condition. Panel D: Medial gastrocnemius activation ended earlier in the non-dominant leg of right- as compared to left-side dominant participants. The violin plots (transparent color) over the boxplots represent the data distribution. The boxplots show the median, the upper, and lower quartiles, and the min and max values. Red error bars within the boxplots represent the 95% confidence interval (CI) around the mean (red dot). Each data point is an individual token: the horizontal jitter is not meaningful and is only used for visualization purposes. * indicates differences between the left and right arms in both standing conditions (p< 0.05). The graphs were created using RStudio software (version 2023.12.0 + 369).
Fig. 4
Fig. 4
Average Muscle Activation Across All Participants. Minor alterations in the neural control of the muscles on the left (L) and right (R) side during clear glass condition (Panel A), left half-field eye patching (Panel B), and right half-field eye patching (Panel C).

References

    1. Patla, A. E. Understanding the roles of vision in the control of human locomotion. Gait Posture. 5, 54–69 (1997).
    1. Hallemans, A., Ortibus, E., Meire, F. & Aerts, P. Low vision affects dynamic stability of gait. Gait Posture. 32, 547–551. 10.1016/j.gaitpost.2010.07.018 (2010). - PubMed
    1. Gazzellini, S. et al. The impact of vision on the dynamic characteristics of the gait: strategies in children with blindness. Exp. Brain Res.234, 2619–2627. 10.1007/s00221-016-4666-9 (2016). - PubMed
    1. Nakamura, T. Quantitative analysis of gait in the visually impaired. Disabil. Rehabil. 19, 194–197. 10.3109/09638289709166526 (1997). - PubMed
    1. Goodale, M. A. Hemispheric differences in motor control. Behav. Brain Res.30, 203–214 (1988). - PubMed

LinkOut - more resources