. 2025 Apr;22(4):764-777.
doi: 10.1038/s41592-025-02610-9. Epub 2025 Feb 20.

Genetically encoded biosensor for fluorescence lifetime imaging of PTEN dynamics in the intact brain

Affiliations

Genetically encoded biosensor for fluorescence lifetime imaging of PTEN dynamics in the intact brain

Tomer Kagan et al. Nat Methods. 2025 Apr.

Abstract

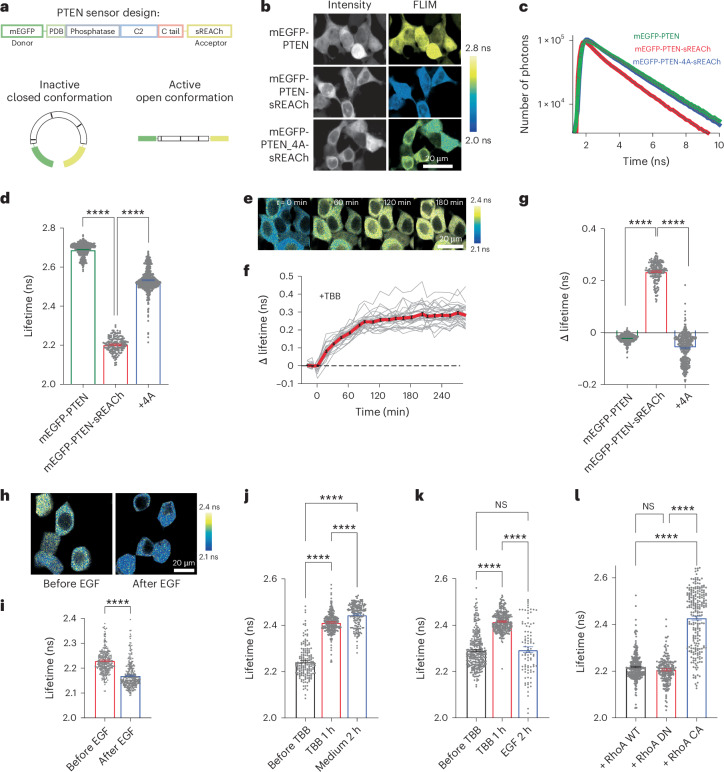
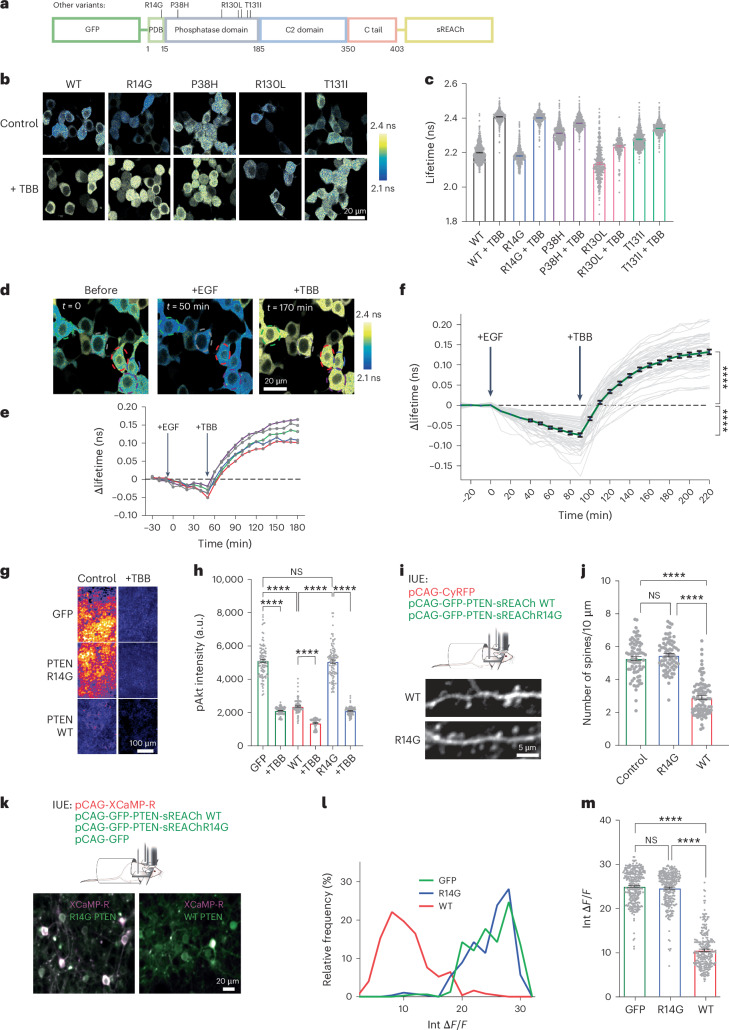
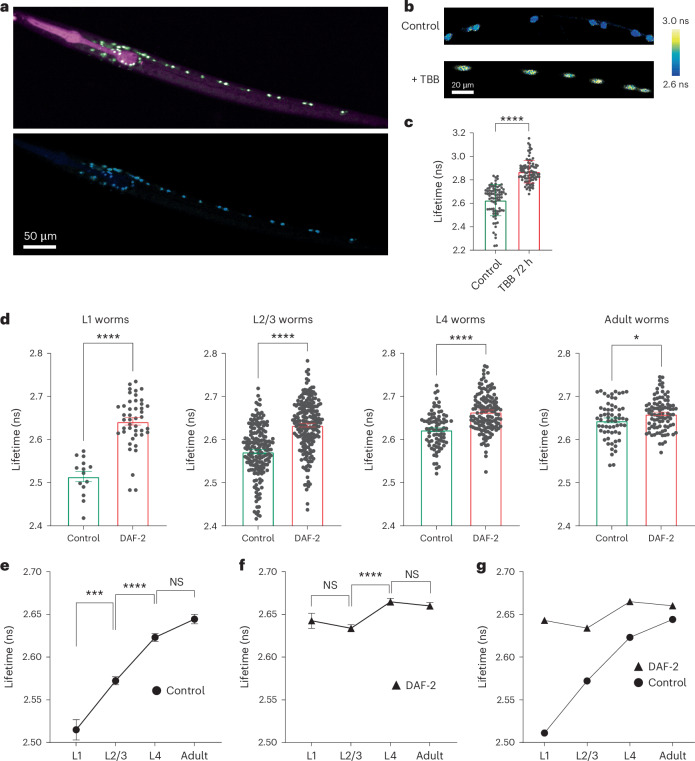
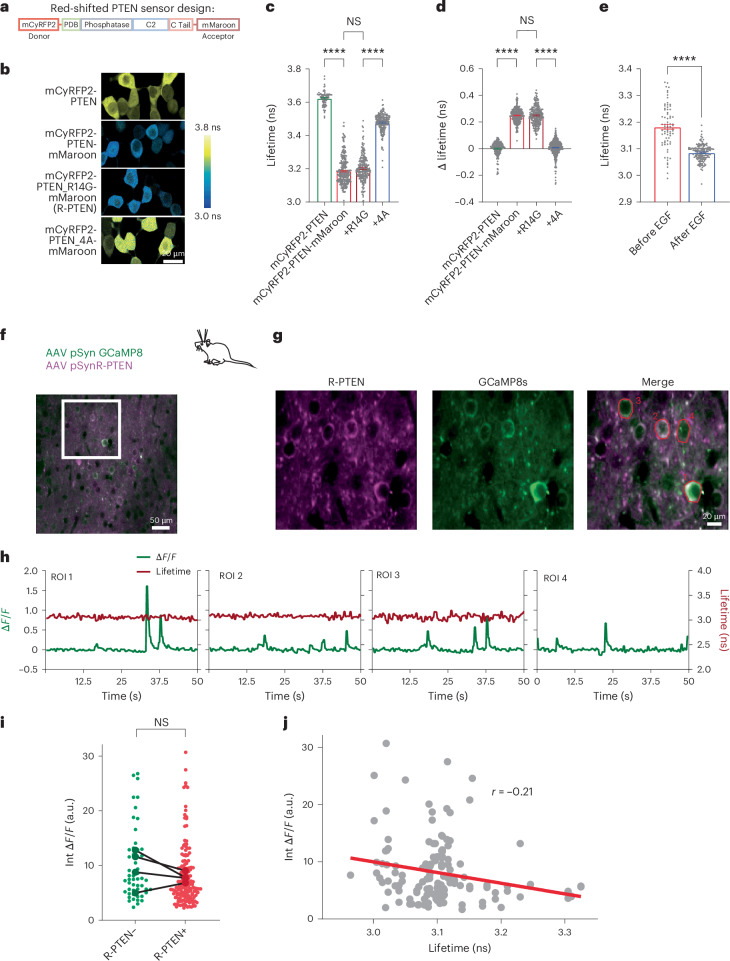
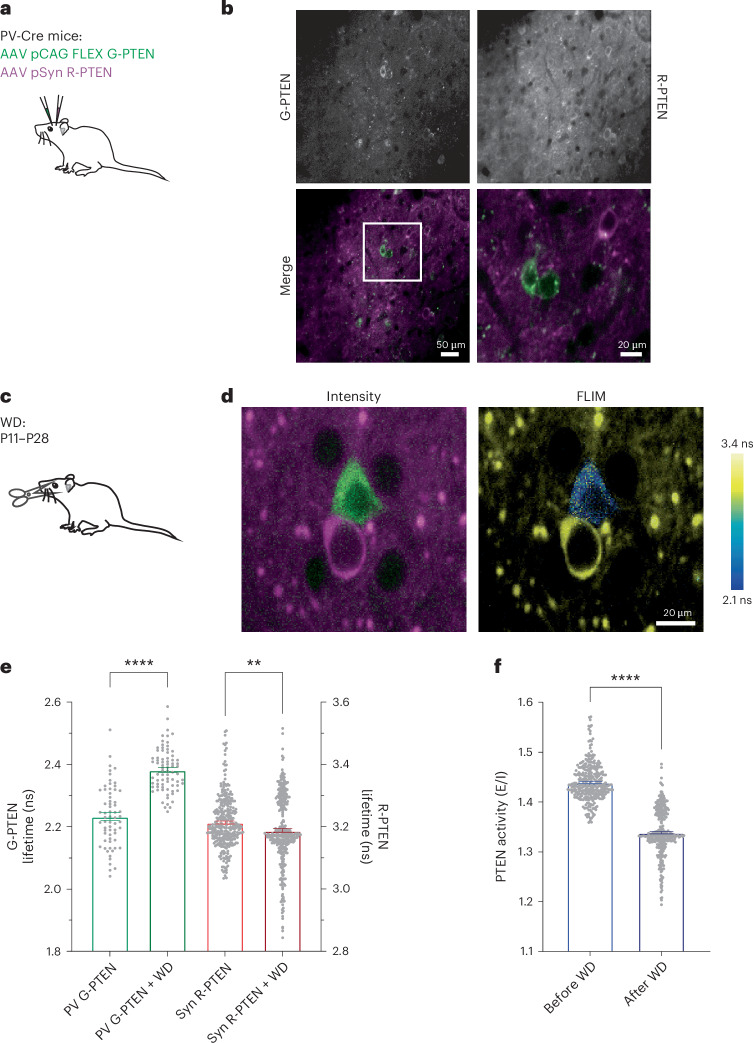
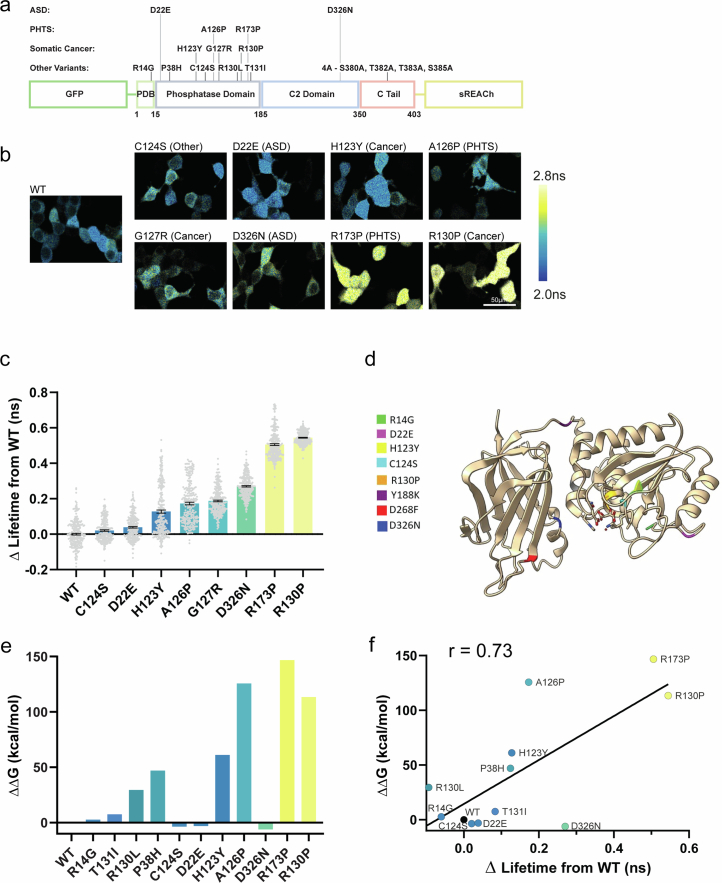
The phosphatase and tensin homolog (PTEN) is a vital protein that maintains an inhibitory brake for cellular proliferation and growth. Accordingly, PTEN loss-of-function mutations are associated with a broad spectrum of human pathologies. Despite its importance, there is currently no method to directly monitor PTEN activity with cellular specificity within intact biological systems. Here we describe the development of a FRET-based biosensor using PTEN conformation as a proxy for the PTEN activity state, for two-photon fluorescence lifetime imaging microscopy. We identify a point mutation that allows the monitoring of PTEN activity with minimal interference to endogenous PTEN signaling. We demonstrate imaging of PTEN activity in cell lines, intact Caenorhabditis elegans and in the mouse brain. Finally, we develop a red-shifted sensor variant that allows us to identify cell-type-specific PTEN activity in excitatory and inhibitory cortical cells. In summary, our approach enables dynamic imaging of PTEN activity in vivo with unprecedented spatial and temporal resolution.


Conflict of interest statement

Competing interests: The authors declare no competing interests.

Figures

Fig. 1
Fig. 1. Development of a new PTEN FRET/FLIM biosensor.
a, Schematic of the FRET/FLIM-based mEGFP-PTEN-sREACh sensor. b, Representative images of fluorescence intensity and pseudo-colored FLIM in HEK293 cells expressing mEGFP-PTEN (donor only), mEGFP-PTEN-sREACh or mEGFP-PTEN-4A-sREACh (4A mutant). Scale bar, 20 μm. c, Representative fluorescence lifetime curves of HEK cells expressing mEGFP-PTEN, mEGFP-PTEN-sREACh or mEGFP-PTEN_4A-sREACh fitted with a double exponential decay. d, Quantification of mean fluorescence lifetime in HEK cells expressing mEGFP-PTEN (2.69 ± 0.001 ns, n = 455), mEGFP-PTEN-sREACh (2.20 ± 0.003 ns, n = 158) or mEGFP-PTEN_4A-sREACh (2.53 ± 0.002 ns, n = 613). e, Representative pseudo-colored FLIM images of HEK cells expressing mEGFP-PTEN-sREACh at different time points following TBB application (50 μM). Scale bar, 20 μm. f, Plot of changes in fluorescence lifetime over time of cells expressing mEGFP-PTEN-sREACh following TBB application. g, Quantification of change in fluorescence lifetime following 3 h of TBB application of mEGFP-PTEN (−0.02 ± 0.001 ns, n = 300), mEGFP-PTEN-sREACh (0.23 ± 0.003 ns, n = 188) or mEGFP-PTEN_4A-sREACh (−0.06 ± 0.003 ns, n = 372). h,i, Pseudo-colored FLIM images and quantification of fluorescence lifetime of HEK293 transfected with mEGFP-PTEN-sREACh before (2.23 ± 0.003 ns, n = 268) and after 100 ng ml−1 recombinant human EGF for 2 h (2.17 ± 0.003 ns, n = 294). Scale bar, 20 μm. j, Quantification of fluorescence lifetime of HEK293 transfected with mEGFP-PTEN-sREACh before TBB (2.24 ± 0.005 ns, n = 166), after 1 h of TBB (2.41 ± 0.003 ns, n = 277) and after cells were washed with medium (2.44 ± 0.004 ns, n = 182). k, Quantification of fluorescence lifetime of HEK293 cells transfected with mEGFP-PTEN-sREACh before TBB (2.29 ± 0.004 ns, n = 290), after 1 h of 50 μM TBB (2.42 ± 0.002 ns, n = 297) and after wash and application of 100 ng ml−1 EGF for 2 h (2.29 ± 0.012 ns, n = 90). Not significant (NS) P = 0.9233. l, Quantification of fluorescence lifetime of HEK293 co-transfected with mEGFP-PTEN-sREACh and WT RhoA (2.22 ± 0.003 ns, n = 332), dominant negative (DN) RhoA (2.20 ± 0.004 ns, n = 201) or constitutively active (CA) RhoA (2.43 ± 0.008 ns, n = 225). NS P = 0.2565. ‘n’ denotes the number of cells. Error bars represent the s.e.m. Statistical difference was measured using one-way analysis of variance (ANOVA) followed by post hoc Tukey’s multiple-comparison test (d, g and jl) and unpaired two-tailed student t-test (i). Representative images represent experiments repeated independently at least three times. Significant differences in d, g and il produced P < 0.0001, unless otherwise stated. ****P < 0.0001. Source data
Fig. 2
Fig. 2. Optimization of the PTEN biosensor to minimize interference with endogenous signaling.
a, Schematic of the PTEN biosensor mutant candidates. b, Pseudo-colored FLIM images of HEK293 transfected with the mEGFP-PTEN-sREACh mutants. Scale bar, 20 μm. c, Quantification of basal fluorescence lifetime of the different mEGFP-PTEN-sREACh candidate mutants, and following 3 h of TBB (50 μM) application. WT (****, 2.20 ± 0.002 ns, n = 502, and 2.41 ± 0.002 ns, n = 295), R14G (****, 2.18 ± 0.002 ns, n = 478, and 2.40 ± 0.002 ns, n = 399) P38H (****, 2.31 ± 0.002 ns, n = 480, and 2.37 ± 0.002 ns, n = 499), R130L (****, 2.14 ± 0.005 ns, n = 352, and 2.24 ± 0.004 ns, n = 202) and T131I (****, 2.28 ± 0.002 ns, n = 495, and 2.34 ± 0.003 ns, n = 503) for control and after TBB application, respectively. d,e, Pseudo-colored FLIM images and continuous time course of single cells expressing mEGFP-PTEN-sREACh containing the R14G mutation before, 50 min after 100 ng ml−1 EGF application and following 2 h from 50 μM TBB application. Individual cells are marked in the same color in the image and graph below. Scale bar, 20 μm. f, Time course of fluorescence lifetime in HEK cells expressing the mEGFP-PTEN-sREACh containing the R14G mutation, following 90 min of 100 ng ml−1 EGF application (****, −0.08 ± 0.004 ns) and after adding 50 μM TBB for 130 min (****, 0.13 ± 0.005 ns). Single cells are shown as gray lines. Average changes are shown as green lines. n = 55 cells. g, Representative images of pAkt staining before and after application of TBB, in cells expressing GFP, mEGFP-PTEN-sREACh WT and mEGFP-PTEN-sREACh R14G. Scale bar, 100 μm. h, Quantification of pAkt staining in cells expressing GFP (5,111 ± 100.5, n = 100, and 2,116 ± 22.92, n = 100), mEGFP-PTEN-sREACh WT (2,366 ± 41.52, n = 100, and 1,366 ± 27.97, n = 100) and mEGFP-PTEN-sREACh R14G (5,059 ± 101.7, n = 100, and 2,103 ± 25.47, n = 100), with and without 50 μM TBB application, respectively. a.u., arbitrary units. i, Schematics of experimental design, and representative in vivo images of fluorescently labeled apical dendrites expressing CyRFP, coexpressing either mEGFP-PTEN-sREACh WT or mEGFP-PTEN-sREACh R14G. Scale bar, 5 μm. j, Quantification of spine density per 10 μm for dendrites expressing CyRFP alone (5.29 ± 0.13, n = 76), CyRFP + mEGFP-PTEN-sREACh R14G (5.49 ± 0.11, n = 75) or CyRFP + mEGFP-PTEN-sREACh WT (2.91 ± 0.11, n = 91). P = 0.475 for CyRFP and R14G comparison. k, Schematics of experimental design, and representative in vivo images of fluorescently labeled L2/3 neurons expressing XCaMP-R (magenta) and mEGFP-PTEN-sREACh WT or R14G sensors (green). Image intensity is summed for 400 frames at a frame rate of 4 Hz. Scale bar, 20 μm. l, Relative frequency histogram of integrated ∆F/F distribution for L2/3 neurons expressing XCaMP-R and coexpressing GFP (n = 4 mice, 316 cells), mEGFP-PTEN-sREAChR14G (NS P = 0.94, n = 3 mice, 281 cells) or mEGFP-PTEN-sREACh WT (n = 3 mice, 249 cells). m, Quantification of integrated ∆F/F of L2/3 neurons expressing XCaMP-R and coexpressing GFP (25.04 ± 0.21, n = 4 mice, 316 cells), mEGFP-PTEN-sREACh R14G (ns, 24.63 ± 0.23, n = 4 mice, 281 cells) or mEGFP-PTEN-sREACh WT (10.58 ± 0.27, n = 4 mice, 249 cells). NS, P = 0.403. ‘n’ denotes the number of cells unless noted otherwise. Error bars represent the s.e.m. Statistical differences for c, f, h, j and m were measured using one-way ANOVA followed by post hoc Tukey’s multiple-comparison test. Statistical differences for l were measured using the Kolmogorov–Smirnov test. Statistical difference for e was measured using an unpaired two-tailed student t-test. Representative images represent experiments repeated independently at least three times. Significant differences in f, h, j and m produced P < 0.0001. ****P < 0.0001. Source data
Fig. 3
Fig. 3. Development and utilization of a transgenic C. elegans to detect PTEN signaling.
a, Top, representative fluorescence image of labeled C. elegans with pan-neuronal G-PTEN (green) and pharyngeal marker (magenta). Bottom, pseudo-colored FLIM image of the same field of view. Scale bar, 50 μm. b,c, Pseudo-colored FLIM images and quantification in neurons of C. elegans expressing pan-neuronal G-PTEN before (2.63 ± 0.02 ns, n = 81) and after (2.87 ± 0.01 ns, n = 90) 72 h of 500 μM TBB. Scale bar, 20 μm. d, Quantification of fluorescence lifetime of G-PTEN at each stage of larval development, with or without daf-2 RNAi. Larvae were measured at L1 stage (2.51 ± 0.014 ns, n = 14, and 2.64 ± 0.01 ns, n = 44), L2/3 stage (2.57 ± 0.005 ns, n = 184, and 2.63 ± 0.004 ns, n = 204), L4 stage (2.62 ± 0.005 ns, n = 82, and 2.66 ± 0.004 ns, n = 141) or adulthood (P = 0.02, 2.64 ± 0.006 ns, n = 61, and 2.66 ± 0.004 ns, n = 90) without or with daf-2 RNAi, respectively. eg, Quantification of fluorescence lifetime of G-PTEN transgenic C. elegans neurons comparing each stage of larval development, for control group or with daf-2 RNAi. In e, ***P = 0.0005 and NS P = 0.1004. In f, NS P = 0.7504 and P = 0.9099 for L1 compared to L2/3 and for L4 compared to adult, respectively. ‘n’ denotes number of cells. Error bars represent the s.e.m. Statistical differences for d and e were measured using an unpaired two-tailed student t-test. Statistical differences for f and g were measured using one-way ANOVA followed by post hoc Tukey’s multiple-comparison test. Representative images represent experiments repeated independently at least three times. Significant differences in cf produced P < 0.0001, unless otherwise stated. ****P < 0.0001. Source data
Fig. 4
Fig. 4. In vivo imaging of PTEN in the mouse brain.
a, Top, schematic of IUE followed by in vivo 2pFLIM in the adult mouse brain. Bottom, representative widefield images of fluorescence intensity and FLIM of L2/3 cells expressing G-PTEN. Scale bar, 100 μm. b, Representative high-magnification images of fluorescence intensity and pseudo-colored lifetime of G-PTEN expression in L2/3 soma (top) and dendrite (bottom). Scale bars, 20 μm (soma) and 15 μm (dendrite). c, Quantification of fluorescence lifetime in G-PTEN-expressing neuronal somas (2.20 ± 0.004 ns, n = 142 cells) and dendrites (2.11 ± 0.009 ns, n = 75), in four mice. d, Representative two-photon in vivo images of L2/3 neuronal somas coexpressing G-PTEN, spCas9 and scrambled control gRNA (Scr), IGF1R gRNA or a Tsc2-targeted gRNA. Scale bar, 20 μm. e, Quantification of G-PTEN fluorescence lifetime in L2/3 neuronal somas targeted with scrambled control gRNA (2.17 ± 0.006 ns, n = 56 cells), an IGF1R-targeted gRNA (P = 0.0005, 2.22 ± 0.013 ns, n = 64 cells) or a Tsc2-targeted gRNA (P = 0.0006, 2.22 ± 0.01 ns, n = 40 cells); 4–6 mice per group, NS P = 0.9263. f, Quantification of L2/3 soma area of neurons expressing scrambled gRNA (693.1 ± 22.86 μm2, n = 57 cells), IGF1R gRNA (P = 0.0009, 537.5 ± 12.87 μm2, n = 70 cells) or Tsc2 gRNA (1,652 ± 66.87 μm2, n = 39 cells); 4–6 mice per group. g, Representative two-photon in vivo images of L2/3 neuronal dendrites coexpressing G-PTEN, spCas9 and scrambled control gRNA (Scr), IGF1R gRNA or Tsc2 gRNA. Scale bar, 5 μm. h, Quantification of G-PTEN fluorescence lifetime in L2/3 neurons targeted with scrambled control gRNA (2.07 ± 0.009 ns, n = 45, and 2.04 ± 0.005 ns, n = 94), IGF1R gRNA (2.14 ± 0.016 ns, n = 31, and 2.02 ± 0.015 ns, n = 49) or Tsc2 gRNA (2.07 ± 0.008 ns, n = 65, and 1.91 ± 0.012 ns, n = 120) for their dendritic shafts and spines, respectively. *P = 0.0188. NS P > 0.9999 and P = 0.8882 for Scrambled Shaft compared to Tsc2 gRNA Shaft and for Scrambled Spine compared to IGF1R gRNA Spine, respectively; 4–6 mice per group. i, Quantification of spine density per 10 μm for G-PTEN neurons expressing scrambled control gRNA (5 ± 0.09, n = 35 dendrites), IGF1R-targeted gRNA (P = 0.0197, 2.93 ± 12.87, n = 19 dendrites) or a Tsc2-targeted gRNA (14.8 ± 0.7, n = 35 dendrites); 4–6 mice per group. ‘n’ denotes number of cells unless otherwise noted. Error bars represent the s.e.m. Statistical difference for c was measured using an unpaired two-tailed student t-test. Statistical differences for e, f, h and i were measured using one-way ANOVA followed by post hoc Tukey’s multiple-comparison test. Representative images represent experiments repeated independently at least three times. Significant differences in c, e, f, h and i produced P < 0.0001, unless otherwise stated. ****P < 0.0001. Source data
Fig. 5
Fig. 5. Dual imaging of PTEN activity using a red-shifted PTEN sensor.
a, Schematic design of the FRET/FLIM-based mCyRFP2-PTEN-mMaroon sensor. b, Representative images of pseudo-colored FLIM in HEK293 cells expressing mCyRFP2-PTEN (donor only), mCyRFP2-PTEN-mMaroon, mCyRFP2-PTEN-mMaroon R14G (R-PTEN) or mCyRFP2-PTEN-4A-mMaroon (4A mutant). Scale bar, 20 μm. c, Quantification of mean fluorescence lifetime in HEK cells expressing mCyRFP2-PTEN (3.62 ± 0.004 ns, n = 88), mCyRFP2-PTEN-mMaroon (3.19 ± 0.005 ns, n = 279 cells), mCyRFP2-PTEN-mMaroon R14G (3.20 ± 0.005 ns, n = 220) or mCyRFP2-PTEN-4A-mMaroon (3.48 ± 0.004 ns, n = 199). NS P = 0.0941. d, Quantification of change in fluorescence lifetime following 3 h of TBB application in mCyRFP2-PTEN (0.01 ± 0.004 ns, n = 200), mCyRFP2-PTEN-mMaroon (0.25 ± 0.003 ns, n = 292), mCyRFP2-PTEN-mMaroon R14G (0.25 ± 0.004 ns, n = 234) or mCyRFP2-PTEN-4A-mMaroon (0.01 ± 0.003 ns, n = 400). NS P = 0.9987. e, Quantification of fluorescence lifetime of HEK293 cells transfected with R-PTEN before (3.18 ± 0.009 ns, n = 74) and after (3.085 ± 0.002 ns, n = 155) 100 ng ml−1 recombinant human EGF for 2 h. f, Schematic of AAV injections in P3–P4 mice and a low-magnification representative in vivo image of R-PTEN (magenta) and GCaMP8s (green) in L2/3 somatosensory cortex in a P28 mouse. Scale bar, 50 μm. g, In vivo high-magnification images of the boxed region in f of individual L2/3 cells expressing R-PTEN (magenta), GCaMP8s (green) and their merged image. Scale bar, 20 μm. h, Time course of changes in ΔF/F (GCaMP8s, green) and lifetime in the red channel (R-PTEN, red) of cells marked in g in coexpressing cells (region of interest (ROI) 1–3), and in a cell expressing GCaMP8s only (ROI 4). i, Comparison of summed integrated ΔF/F (a.u.) in R-PTEN-negative (n = 53 cells) and R-PTEN-positive (n = 164 cells) neurons, paired for each mouse (N = 4 mice, P = 0.32). j, Correlation between fluorescence lifetime and cumulative summed integrated ΔF/F in R-PTEN+ neurons (P = 0.008, r = −0.21). ‘n’ denotes number of cells unless stated otherwise. Error bars represent the s.e.m. Statistical differences for c and d were measured using one-way ANOVA followed by post hoc Tukey’s multiple-comparison test. Statistical difference for e was measured using unpaired two-tailed student t-test. Statistical difference for i was measured using paired two-tailed student t-test. Correlation was measured using two-tailed Pearson test and graphically plotted using simple linear regression. Representative images represent experiments repeated independently at least three times. Significant differences in ce produced P < 0.0001, unless otherwise stated. ****P < 0.0001. Source data
Fig. 6
Fig. 6. Simultaneous in vivo imaging of PTEN signaling in excitatory and inhibitory cells.
a, Schematic of cell-type-specific AAV injections in neonatal mice. b, Representative images of PV cells labeled with Cre-dependent G-PTEN (left/green) and excitatory cells labeled with R-PTEN (left/magenta) in the somatosensory cortex of a P28 mouse. Widefield scale bar, 50 μm. Zoomed scale bar, 20 μm. c, Schematic of contralateral whisker deprivation (WD) between P11 and P28. d, Representative intensity and FLIM images of excitatory (magenta) and inhibitory (green) cells after WD. Scale bar, 20 μm. e, Quantification of fluorescence lifetime before WD (2.23 ± 0.012 ns, n = 64, and 3.214 ± 0.005 ns, n = 317) and after WD (2.38 ± 0.008 ns, n = 76, and 3.19 ± 0.006 ns, n = 364) for inhibitory G-PTEN-expressing cells (left/green) and excitatory R-PTEN-expressing cells (right/red), respectively. **P = 0.0026; 5–6 mice per group. f, E/I ratio of R-PTEN/G-PTEN fluorescence lifetime before WD (1.44 ± 0.002 ns, n = 317) and after WD (1.34 ± 0.002 ns, n = 364); 5–6 mice per group. ‘n’ denotes number of cells unless stated otherwise. Error bars represent the s.e.m. Statistical difference for e was measured using one-way ANOVA followed by post hoc Tukey’s multiple-comparison test. Statistical difference for f was measured using unpaired two-tailed student t-test. Representative images represent experiments repeated independently at least three times. Significant differences in e and f produced P < 0.0001, unless otherwise stated in the legend above. ****P < 0.0001. Source data
Extended Data Fig. 1
Extended Data Fig. 1. PTEN sensor linker optimization.
a Schematic design of the different FRET/FLIM-based mEGFP-PTEN-sREACh sensor linker versions; combinations of extended linkers on either side of mEGFP-PTEN-sREACh (EL1, EL2 respectively) and truncated linkers on either side of mEGFP-PTEN-sREACh (TL1, TL2 respectively). b Quantification of fluorescence lifetime of the different mEGFP-PTEN-sREACh linker versions. EL1 + EL2 (2.30 ± 0.002 ns, n = 310), EL1 + EL2 4 A (2.52 ± 0.002 ns, n = 223), TL1 + EL2 (2.39 ± 0.009 ns, n = 320), TL1 + EL2 4 A (2.58 ± 0.002 ns, n = 310), TL2 + EL1 (2.33 ± 0.004, n = 320), TL2 + EL1 4 A (2.56 ± 0.002 ns, n = 400), TL1 + TL2 (2.19 ± 0.004 ns, n = 288) or TL1 + TL2 4 A (2.51 ± 0.002 ns, n = 281). Comparisons between WT and 4 A mutation of each variant were all p < 0.0001. (c) Quantification of change in mean fluorescent lifetime (Δ) of the different mEGFP-PTEN-sREACh linker version 4 A mutations from WT; EL1 + EL2 4 A (0.22 ± 0.002 ns, n = 223), TL1 + EL2 4 A (0.19 ± 0.002 ns, n = 310), TL2 + EL1 4 A (0.23 ± 0.002 ns, n = 400), TL1 + TL2 4 A (0.32 ns ±0.002 ns, n = 281). ns p = 0.2106. ‘n’ denotes number of cells, error bars represent s.e.m. statistical differences were measured using one-way ANOVA followed by post-hoc Tukey’s multiple comparison test. Significant differences in (c) produced p < 0.0001, unless otherwise stated. **** p < 0.0001. Source data
Extended Data Fig. 2
Extended Data Fig. 2. Changed in PTEN conformation due to pathogenic mutations.
a Schematic of PTEN mutants, their related pathology and their location along the protein, tested in the mEGFP-PTEN-sREACh biosensor. b Pseudo-colored FLIM images of HEK293 transfected with the mEGFP-PTEN-sREACh mutants. Scale bar; 50 μm. c Quantification of change in fluorescence lifetime of mEGFP-PTEN-sREACh containing mutations compared to WT version (0 ± 0.005 ns, n = 258), C124S (p = 0.16, 0.02 ± 0.004 ns, n = 225), D22E (0.04 ± 0.004 ns, n = 265), H123Y (0.13 ± 0.009 ns, n = 253), A126P (0.18 ± 0.007 ns, n = 250), G127R (0.18 ± 0.004 ns, n = 265), D326N (0.27 ± 0.004 ns, n = 259), R173P (0.50 ± 0.005 ns, n = 265) or R130P (0.54 ± 0.002 ns, n = 254). d Computer generated 3D model of PTEN based on its crystal structure, and the tested mutations’ locations along the protein. e Predicted ΔΔG of PTEN mutants compared to WT. R14G (2.78), T131I (7.52), R130L (29.59), P38H (47.05), C124S (-3.59), D22E (-2.99), H123Y (61.15), A126P (125.72), D326N (-6.03), R173P (146.70), R130P (113.44). Numbers represent units of kcal/mol. f Correlation between ΔΔG of PTEN mutants and their corresponding measured changes in fluorescence lifetime of mEGFP-PTEN-sREACh compared to WT (p = 0.007, r = 0.73). ‘n’ denotes number of cells, Error bars represent s.e.m. statistical difference for (c) was measured using one-way ANOVA followed by post-hoc Tukey’s multiple comparison test. Correlation was measured using two-tailed Pearson test and plotted using simple linear regression. One computer predicted outlier (G127R) was found and removed using Grubbs test for outliers (Alpha = 0.01). Representative images represent experiments repeated independently at least 3 times. Significant differences in (b) produced p < 0.0001, unless otherwise stated in the legend above. **** p < 0.0001. Source data
Extended Data Fig. 3
a Quantification of fluorescence intensity in HEK293 cells expressing mEGFP-PTEN-sREACh WT (28503 ± 670, n = 504), R14G (29750 ± 1105, n = 200), P38H (37229 ± 859, n = 480), R130L (5788 ± 441, n = 353) or T131I (49850 ± 1292, n = 495). ns- p = 0.9396. b Quantification of normalized phosphatase activity of GFP (1 ± 0.02, n = 9), mEGFP-PTEN-sREACh WT (1.16 ± 0.02, n = 9) and mEGFP-PTEN-sREACh R14G (1 ± 0.02, n = 9) on the substrate PI(3,4,5)P3 diC8. *** p = 0.0003, ns p > 0.9999. c Representative images of CyRFP before and after 3Hr of application of TBB (50 μM) in cells co-expressing mEGFP-PTEN-sREACh WT, or mEGFP-PTEN-sREACh R14G. Scale bar; 20 μm. d Quantification of cell area of CyRFP alone, before (1958 ± 33.40 μm2, n = 82, 1709 ± 30.15 μm2, n = 88), + mEGFP-PTEN-sREACh WT (1245 ± 26.78 μm2, n = 109, 1247 ± 34.35 μm2, n = 62), or with mEGFP-PTEN-sREACh R14G (1951 ± 42.25 μm2, n = 92, 1707 ± 53.80 μm2, n = 75) before and after TBB application, respectively. ns p > 0.9999 for CyRFP Control compared to R14G + CyRFP Control, for CyRFP TBB compared to R14G + CyRFP TBB, and for WT + CyRFP Control compared to WT + CyRFP TBB. e Representative images for staining with a PTEN Ab (magenta) in HEK cells expressing the mEGFP-PTEN-sREACh R14G (green). Scale bar; 50 μm. f Quantification of normalized intensity for PTEN staining in HEK cells transfected with either mEGFP-PTEN-sREACh WT or mEGFP-PTEN-sREACh R14G. Comparison of cells without (1 ± 0.04, n = 122), and with WT sensor (2.24 ± 0.07, n = 122), without (1 ± 0.05, n = 99) and with R14G sensor (2.03 ± 0.07, n = 99). ns p > 0.9999 and p = 0.0899 for WT- vs. R14G- and WT+ vs. R14G + , respectively. g-h Representative western blot image and quantification of PTEN expression in HEK293 cells transfected with mEGFP-PTEN-sREACh WT or mEGFP-PTEN-sREACh R14G at indicated concentrations. Cells were lysed and analyzed by SDS-PAGE/western blotting using anti-PTEN and anti-GAPDH antibodies. GFP-PTEN (overexpressed) and PTEN (endogenous) bands were detected on the same blot but with different exposures. Ladder sizes are in kDa, n = 3 independent biological repeats. ‘n’ denotes number of cells unless stated otherwise, error bars represent s.e.m. statistical differences for (a, c) were measured using one-way ANOVA followed by post-hoc Tukey’s multiple comparison test. Statistical difference for (e) was measured using unpaired two-tailed student t-test. Representative images represent experiments repeated independently at least 3 times. Significant differences in (a, d, f) produced p < 0.0001, unless otherwise stated in the legend above. **** p < 0.0001. Source data
Extended Data Fig. 4
Extended Data Fig. 4. Signal-to-noise in vitro analysis of the PTEN sensor.
a-b Representative pseudo-colored images of fluorescent lifetime summed for different frame duration, for G-PTEN before and after 3 hr of 50 μM TBB application. Representative images represent experiments repeated independently at least 3 times. Scale bar; 50 μm. c-d Standard deviation of signal-to-noise of mEGFP-PTEN-sREACh before and after TBB, as a function of number of photons from each cell. Each point represents individual cells for frame-to-frame (left) or individual experiments over one field of view for cell-to-cell (right) variation. The binding fraction’s theoretical change caused by shot noise is represented by the black curve (see methods for equation). e-f Standard deviation of signal-to-noise of G-PTEN before and after TBB, as a function of the number of photons from each cell. Each point represents individual cells for frame-to-frame (left) or individual experiments over one field of view for cell-to-cell (right). The binding fraction’s theoretical change caused by shot noise is represented by the black curve. Source data
Extended Data Fig. 5
Extended Data Fig. 5. In vivo morphological characterization of the PTEN sensor.
a Representative images of G-PTEN fluorescence intensity with or without spCas9 and PTEN gRNA. G-PTEN was modified from rat sequence which differs in one nucleotide to mouse PTEN which matches the gRNA template. Scale bar; 20 μm. b Quantification of the fluorescent intensity of the PTEN biosensor co-expressing PTEN gRNA with the mean of G-PTEN alone, for the rat-based version (0.473 ± 0.01, n = 380) and mouse-based sensor (0.003 ± 0, n = 400). (c) Schematic of experimental design for IUE injections, and in vivo 2pFLIM in adult mice. d Representative 2p in vivo images of CyRFP labeled L2/3 cells, co-expressing spCas9 and scrambled control gRNA (Scr), or a PTEN targeted gRNA, and with co-expression of mEGFP-PTEN-sREACh WT or R14G. Scale bar; 30 μm. e Quantification of neuron soma area in μm2 indicated by CyRFP, for neurons co-expressing scrambled guide RNA (696.6 ± 14.72, n = 62), PTEN gRNA (1646 ± 32.77, n = 93), PTEN gRNA+mEGFP-PTEN-sREACh WT (791.5 ± 14.5, n = 78) and PTEN gRNA + mEGFP-PTEN-sREACh R14G (1634 ± 28.87, n = 74). ns p = 0.0787 and p = 0.1554 for Scrambled gRNA compared to PTEN gRNA + WT and for PTEN gRNA compared to PTEN gRNA + R14G respectively. 4-6 mice for each group. f Representative in vivo images of fluorescently labeled apical dendrites expressing CyRFP, and co-expressing spCas9 and scrambled guide RNA or PTEN targeted gRNA, and co-expressing either mEGFP-PTEN-sREACh WT or R14G. Scale bar; 10 μm. 4-6 mice for each group. g Quantification of spine density per 10 μm for dendrites expressing CyRFP and scrambled guide RNA (5.087 ± 0.161, n = 43), PTEN gRNA (11.72 ± 0.53, n = 26), PTEN gRNA + mEGFP-PTEN-sREACh WT (5.18 ± 0.18, n = 40), and PTEN gRNA + mEGFP-PTEN-sREACh R14G (11.77 ± 0.29, n = 49). ns p = 0.9956 and p = 0.9995 for Scrambled gRNA compared to PTEN gRNA + WT and for PTEN gRNA compared to PTEN gRNA + R14G respectively. 4-6 mice for each group. ‘n’ denotes number of cells, Error bars represent s.e.m. statistical differences for (e, g) were measured using one-way ANOVA followed by post-hoc Tukey’s multiple comparison test. Statistical difference for (b) was measured using unpaired two-tailed student t-test. Representative images represent experiments repeated independently at least 3 times. Significant differences in (b, e, g) produced p < 0.0001, unless otherwise stated in the legend above. **** p < 0.0001. Source data
Extended Data Fig. 6
Extended Data Fig. 6. In vitro characterization of the PTEN sensor.
a Representative images of fluorescent intensity in HEK293 cells expressing either mEGFP-PTEN-sREACh WT, and with the R14G or the K13E mutation. Scale bar; 20 μm. b Quantification of normalized intensity of Cytosol / Nucleus in HEK293 cells expressing either mEGFP-PTEN-sREACh WT (1 ± 0.05, n = 137), with the R14G (ns, 1.05 ± 0.04, n = 143) or K13E mutation (****,0.16 ± 0.003, n = 209). ns p = 0.5206. c Quantification of fluorescent lifetime in HEK293 expressing G-PTEN before pharmacology application (2.22 ± 0.004 ns, n = 75), after overnight application of 10 μM MG132 (****, 2.32 ± 0.004 ns, n = 117), after 3 hr of 50 μM TBB application (****, 2.38 ± 0.003 ns, n = 50), and after 3 hr of 50 μM TBB application following overnight application of 10 μM MG132 (****, 2.44 ± 0.004 ns, n = 120). ns p = 0.088 for R14G + TBB vs. R14G + MG132 + TBB. d Quantification of fluorescent lifetime in HEK293 expressing mEGFP-PTEN-sREACh 4 A before pharmacology application (2.50 ± 0.003 ns, n = 60), after overnight application of 10 μM MG132 (***, 2.48 ± 0.004 ns, n = 126), after 3 hr of 50 μM TBB application (ns, 2.49 ± 0.002 ns, n = 50), and after 3 hr of 50 μM TBB application following overnight application of 10 μM MG132 (ns, 2.47 ± 0.003 ns, n = 108). *** p = 0.0004 for 4 A vs. 4 A + MG132. ns p = 0.5678, p = 0.0654 and p = 0.9890 for 4 A vs. 4 A + TBB, 4 A + TBB vs. 4 A + MG132 + TBB, and 4 A + MG132 vs. 4 A + MG132 + TBB respectively. e Quantification of dimerization, measured by fluorescent lifetime in HEK293 expressing PTEN-sREACh WT and co-expressing either mEGFP-PTEN WT (****, 2.69 ± 0.001 ns, n = 144 and 2.67 ± 0.001 ns, n = 140), mEGFP-PTEN R14G (****, 2.69 ± 0.001 ns, n = 140 and 2.67 ± 0.001 ns, n = 130) or mEGFP-PTEN C124S (****, 2.66 ± 0.001 ns, n = 161 and 2.62 ± 0.001 ns, n = 244), before and after 3 hr of 50 μM TBB application respectively. ‘n’ denotes number of cells, Error bars represent s.e.m. statistical differences for (b, c, d, e) were measured using one-way ANOVA followed by post-hoc Tukey’s multiple comparison. Representative images represent experiments repeated independently at least 3 times. Significant differences in (b-e) produced p < 0.0001, unless otherwise stated in the legend above. **** p < 0.0001. Source data
Extended Data Fig. 7
Extended Data Fig. 7. Signal-to-noise in vivo analysis of the PTEN sensor.
a Representative images of fluorescent lifetime summed over different frames numbers, for G-PTEN in single L2/3 cells in vivo. Representative images represent experiments repeated independently at least 3 times. Scale bar; 20 μm. b Standard deviation of signal-to-noise of G-PTEN in vivo, as a function of the amount of photons from each cell. Each point represents individual cells for frame-to-frame (left) or individual experiments over one field of view for cell-to-cell (right). The binding fraction’s theoretical change caused by shot-noise is represented by the black curve (see methods for equation).
Extended Data Fig. 8
Extended Data Fig. 8. Validation of gRNA targeting and in vivo PTEN sensor expression.
a Representative images of pS6 stained cortical brain slices, in WT hemisphere (control) and the hemisphere expressing G-PTEN, spCas9 and an IGF1R targeted gRNA. b Quantification of pS6 normalized intensity on stained cortical brain slices, within the WT hemisphere not expressing GFP (1 ± 0.145, n = 261) and gRNA targeted IGF1R hemisphere co-expressing GFP (2.33 ± 0.044, n = 349). c Representative images of HEK293 co-expressing Cerulean tagged IGF1R, spCas9 and either scrambled control gRNA or IGF1R targeted gRNA. Scale bar; 50 μm. d Quantification of Cerulean-IGF1R normalized intensity in HEK293 cells with either scrambled (Scr) control gRNA (14.07 ± 0.205, n = 201) or IGF1R targeted gRNA (1 ± 0.039, n = 212). e Representative images of pS6 stained cortical brain slices, in WT hemisphere (control) and the hemisphere expressing G-PTEN, spCas9 and an Tsc2 targeted gRNA. Scale bar; 100 μm. f Quantification of pS6 normalized intensity on stained cortical brain slices, within the WT hemisphere not expressing GFP (1 ± 0.009, n = 340) and gRNA targeted Tsc2 hemisphere co-expressing GFP (2.65 ± 0.019, n = 342). g Analysis of in vivo FRAP time-course for dendritic shaft (green) and spines (blue), showing similar fluorescence recovery kinetics. n = 36 spines and 20 dendrites, in 3 mice. h Representative image of VGAT staining in cortical brain slices, for cells co-expressing AAV pSyn-R-PTEN. Scale bar; 100 μm, VGAT positive and R-PTEN positive cells are marked. Overall, for n = 7736 cells, 90.81% were negative for VGAT. i Representative image of a cortical slice, stained for PTEN, for cells expressing AAV pSyn-R-PTEN. Scale bar; 150 μm. j Quantification of normalized intensity for total PTEN levels L2/3 cortical neurons without (1 ± 0.01, n = 121) and with R-PTEN (****, 1.79 ± 0.01, n = 134) in the same field of view. k Representative image of a cortical slice stained for pS6, in a mouse expressing injected with AAV pSyn-R-PTEN. Scale bar; 50 μm. l Quantification of normalized intensity for pS6 in cells without (1 ± 0.01, n = 100) and with R-PTEN (1.02 ± 0.01, n = 100) in the same field of view. ns p = 0.2358. ‘n’ denotes number of cells unless otherwise noted, Error bars represent s.e.m. statistical difference for (c, e) were measured using unpaired two-tailed student t-test. Representative images represent experiments repeated independently at least 3 times. Significant differences in (b, d) produced p < 0.0001, unless otherwise stated in the legend above. **** p < 0.0001. Source data
Extended Data Fig. 9
Extended Data Fig. 9. PTEN activity in astrocytes.
a Representative images of fluorescence intensity and FLIM of L2/3 neurons and astrocytes expressing G-PTEN after PiggyBac IUE injection. Scale bar; 100 μm. b Quantification of fluorescence lifetime in astrocytes (2.09 ± 0.013 ns, n = 104 cells) and in L2/3 neurons (2.19 ± 0.006 ns, n = 129 cells), in 3 mice. Error bars represent s.e.m. statistical differences for (b) were measured using one-way ANOVA followed by post-hoc Tukey’s multiple comparison test. Representative images represent experiments repeated independently at least 3 times. Significant differences in (b) produced p < 0.0001. **** p < 0.0001. Source data
Extended Data Fig. 10
Extended Data Fig. 10. Characterization of dual-color PTEN sensors.
a Quantification of fluorescence lifetime in HEK293 co-expressing G-PTEN (****, 2.22 ± 0.003 ns, n = 231 and 2.43 ± 0.003 ns, n = 217) and R-PTEN (****, 3.08 ± 0.003 ns, n = 234 and 3.31 ± 0.003 ns, n = 207), before and after 3 hr of 50 μM TBB application, respectively. b Quantification of fluorescence lifetime in HEK293 co-expressing G-PTEN (****, 2.23 ± 0.004 ns, n = 149 and 2.48 ± 0.004 ns, n = 165) and mCyRFP2-PTEN-mMaroon 4 A (ns, 3.41 ± 0.002 ns, n = 169 and 3.42 ± 0.001 ns, n = 158), both before and after 3 hr of 50 μM TBB application, respectively. ns p = 0.0713. c Quantification of fluorescence lifetime in HEK293 co-expressing mEGFP-PTEN-sREACh 4 A (ns, 2.51 ± 0.001 ns, n = 195 and 2.51 ± 0.001 ns, n = 178) and R-PTEN (****, 3.12 ± 0.005 ns, n = 195 and 3.43 ± 0.006 ns, n = 178), both before and after 3 hr of 50 μM TBB application, respectively. ns p = 0.6557. d Representative fluorescence intensity and lifetime images of PV-Cre mouse after AAV injection of Cre dependent G-PTEN. Scale bar; 20 μm. e Quantification of fluorescence lifetime in mice with PV targeted G-PTEN (2.20 ± 0.007 ns, n = 14) and in mice co-expressing G-PTEN in PV cells and R-PTEN expressing in excitatory neurons. (2.23 ± 0.012 ns, n = 64). ns p = 0.2165. f Representative images of WT mouse after simultaneous AAV injection of Syn R-PTEN, Syn Cre and FLEX G-PTEN. Widefield scale bar; 100 μm. Zoomed scale bar; 20 μm. g Representative images of HEK293 without or with Cre, co-expressing the FLEX R-PTEN or FLEX G-PTEN sensors with mEGFP or mCyRFP markers, respectively. Scale bar; 50 μm. ‘n’ denotes number of cells, error bars represent s.e.m. statistical difference for (a, b, c) was measured using unpaired two-tailed student t-test, statistical differences for (d) were measured using one-way ANOVA followed by post-hoc Tukey’s multiple comparison test. Representative images represent experiments repeated independently at least 3 times. Significant differences in (a-c) produced p < 0.0001, unless otherwise stated in the legend above. **** p < 0.0001. Source data

Similar articles

Cited by

References

    1. Worby, C. A. & Dixon, J. E. PTEN. Annu. Rev. Biochem.83, 641–669 (2014). - PubMed
    1. Stambolic, V. et al. Negative regulation of PKB/Akt-dependent cell survival by the tumor suppressor PTEN. Cell95, 29–39 (1998). - PubMed
    1. Funamoto, S., Meili, R., Lee, S., Parry, L. & Firtel, R. A. Spatial and temporal regulation of 3-phosphoinositides by PI 3-kinase and PTEN mediates chemotaxis. Cell109, 611–623 (2002). - PubMed
    1. Li, Z. et al. Regulation of PTEN by Rho small GTPases. Nat. Cell Biol.7, 399–404 (2005). - PubMed
    1. Liang, H. et al. PTENα, a PTEN isoform translated through alternative initiation, regulates mitochondrial function and energy metabolism. Cell Metab.19, 836–848 (2014). - PMC - PubMed