

Development of a predictive nomogram based on preoperative inflammation-nutrition-related markers for prognosis in locally advanced lip squamous cell carcinoma after surgical treatment
- PMID: 39979915
- PMCID: PMC11843749
- DOI: 10.1186/s12903-025-05663-6
Development of a predictive nomogram based on preoperative inflammation-nutrition-related markers for prognosis in locally advanced lip squamous cell carcinoma after surgical treatment
Abstract
Background: The prognostic role of preoperative inflammation-nutrition-related markers in locally advanced lip squamous cell carcinoma (LSCC) remains underexplored. This study aimed to assess the impact of various preoperative inflammation-nutrition-related markers on the prognosis of patients with locally advanced LSCC undergoing surgical treatment and to establish a corresponding predictive model.
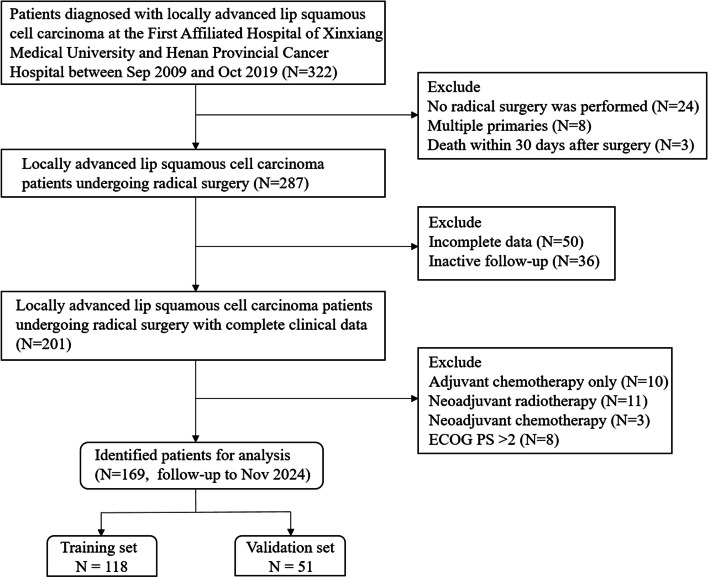
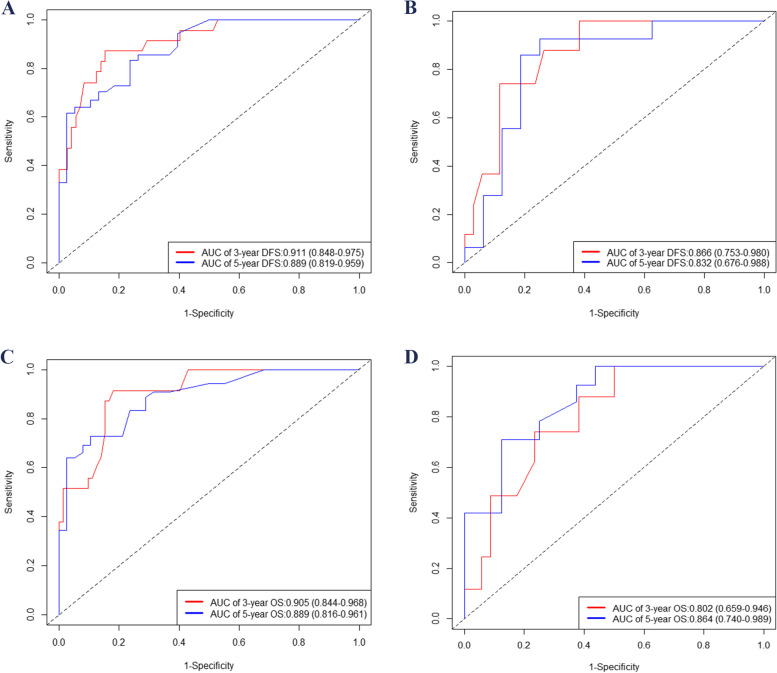
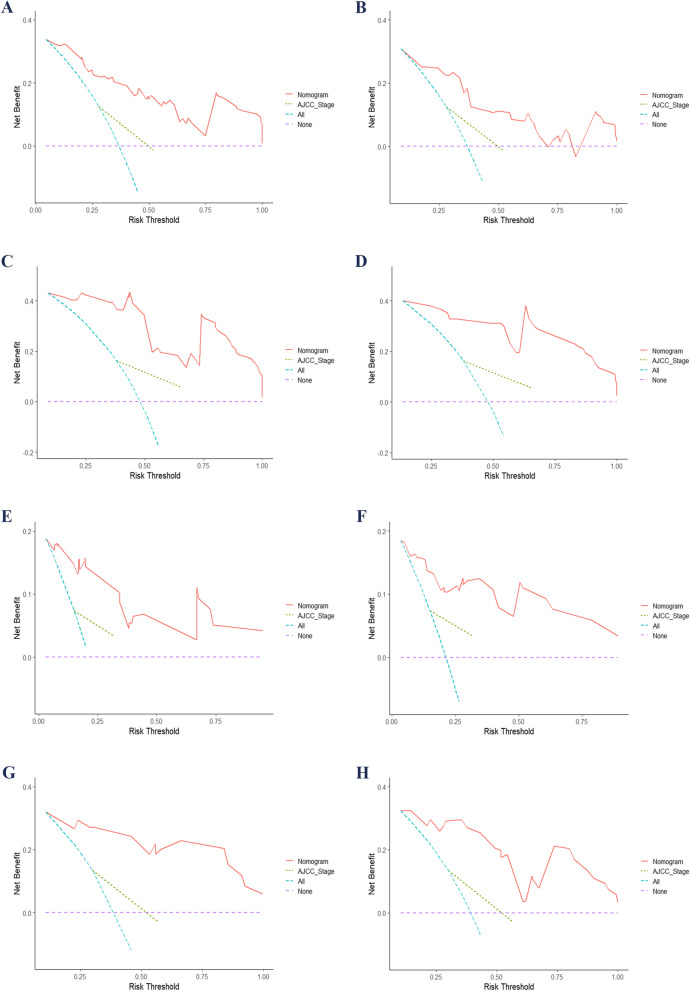
Methods: A retrospective analysis was performed on the clinical data of 169 patients with locally advanced LSCC who underwent surgical treatment. A total of 27 clinicopathological variables, including inflammation-nutrition-related markers, were collected. Univariate and multivariate Cox regression analyses were used to identify independent prognostic factors for disease-free survival (DFS) and overall survival (OS). The nomogram models were validated using receiver operating characteristic (ROC) curve analysis, calibration plots, and decision curve analysis (DCA). Risk stratification was performed based on the nomogram scores, and differences between risk subgroups were explored.
Results: The extranodal extension (ENE), surgical safety margin, Glasgow prognostic score (GPS), Geriatric Nutritional Risk Index (GNRI), Controlling Nutrition score (CONUT), American Joint Committee on Cancer (AJCC) stage, and adjuvant radiotherapy were independent prognostic factors for DFS. In contrast, ENE, surgical safety margin, GNRI, CONUT, AJCC stage, and adjuvant radiotherapy were also independent prognostic factors for OS. The nomograms demonstrated better predictive performance than the AJCC staging system. Based on the nomogram model, patients were stratified into low-, medium-, and high-risk subgroups, which exhibited significant differences in survival outcomes.
Conclusion: GPS, GNRI, and CONUT are independent factors affecting the prognosis of patients with locally advanced LSCC undergoing radical surgery. By combining GPS, GNRI, and COUNT with other independent clinicopathological prognostic factors, a reliable nomogram model can be established to accurately predict patients' DFS and OS. This provides a powerful tool for individualized prognostic assessment, optimized risk stratification, and treatment decision-making.
Keywords: Controlling nutrition score; Geriatric nutritional risk index; Inflammation-nutrition-related markers; Lip squamous cell carcinoma; Prognosis.
© 2025. The Author(s).
Conflict of interest statement
Declarations. Ethics approval and consent to participate: The study adhered to the principles outlined in the Declaration of Helsinki. Ethics approval was obtained from the Ethics Committee of the First Affiliated Hospital of Xinxiang Medical University, and the clinical trial number was EC-024–496. Written informed consent was provided by all patients. Consent for publication: Not applicable. Competing interests: The authors declare no competing interests.
Figures


Similar articles
-
Nomogram based on immune-inflammatory indicators and age-adjusted charlson comorbidity index score to predict prognosis of postoperative parotid gland carcinoma patients.BMC Oral Health. 2024 Jun 22;24(1):718. doi: 10.1186/s12903-024-04490-5. BMC Oral Health. 2024. PMID: 38909208 Free PMC article.
-
The prognostic significance of the geriatric nutritional risk index in postoperative parotid gland carcinoma.Sci Rep. 2025 Jul 1;15(1):22309. doi: 10.1038/s41598-025-08609-8. Sci Rep. 2025. PMID: 40595347 Free PMC article.
-
Prognostic significance of preoperative Naples prognostic score for disease-free and overall survival in oral cavity squamous cell carcinoma post-surgery.BMC Cancer. 2025 Apr 22;25(1):757. doi: 10.1186/s12885-025-14146-4. BMC Cancer. 2025. PMID: 40264051 Free PMC article.
-
Survival risk stratification based on prognosis nomogram to identify patients with esophageal squamous cell carcinoma who may benefit from postoperative adjuvant therapy.BMC Cancer. 2024 Oct 29;24(1):1330. doi: 10.1186/s12885-024-13085-w. BMC Cancer. 2024. PMID: 39472872 Free PMC article.
-
Prognostic role of geriatric nutritional risk index (GNRI) and controlling nutritional status (CONUT) on outcomes in patients with head and neck cancer: a systematic review and meta-analysis.BMC Cancer. 2025 Feb 11;25(1):242. doi: 10.1186/s12885-025-13565-7. BMC Cancer. 2025. PMID: 39934700 Free PMC article.
References
-
- Bray F, Laversanne M, Sung H, Ferlay J, Siegel RL, Soerjomataram I, Jemal A. Global cancer statistics 2022: GLOBOCAN estimates of incidence and mortality worldwide for 36 cancers in 185 countries. CA Cancer J Clin. 2024;74(3):229–63. - PubMed
-
- Han AY, Kuan EC, Mallen-St Clair J, Alonso JE, Arshi A, St John MA. Epidemiology of Squamous Cell Carcinoma of the Lip in the United States: A Population-Based Cohort Analysis. JAMA Otolaryngol Head Neck Surg. 2016;142(12):1216–23. - PubMed
MeSH terms
Substances
Grants and funding
LinkOut - more resources
Full Text Sources
