. 2025 Feb 20;23(1):207.
doi: 10.1186/s12967-024-06024-7.

Intra and inter-organ communication through extracellular vesicles in obesity: functional role of obesesomes and steatosomes

Affiliations

Intra and inter-organ communication through extracellular vesicles in obesity: functional role of obesesomes and steatosomes

N Lago-Baameiro et al. J Transl Med. .

Abstract

Background: Extracellular vesicles (EVs) represent a sophisticated mechanism of intercellular communication that is implicated in health and disease. Specifically, the role of EVs in metabolic regulation and their implications in metabolic pathologies, such as obesity and its comorbidities, remain unclear.

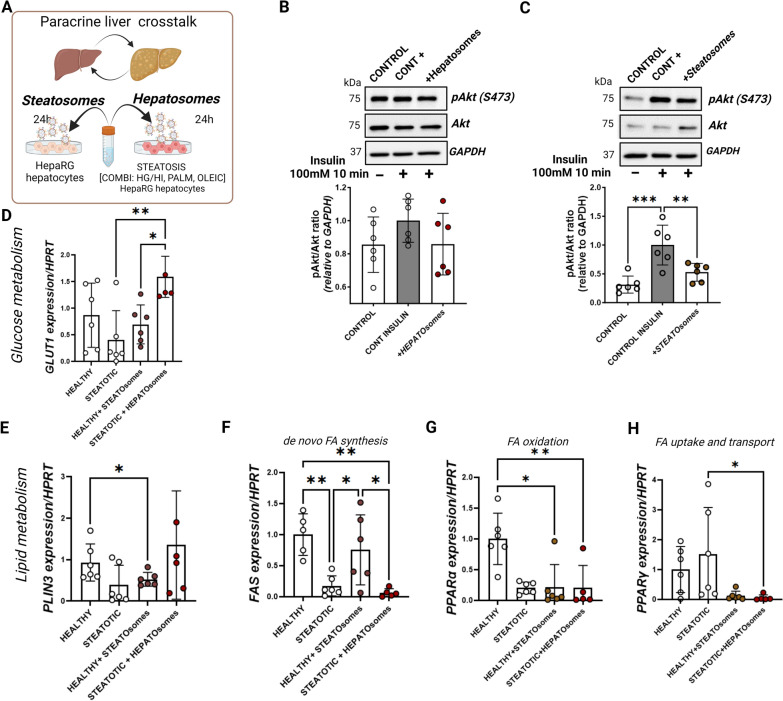
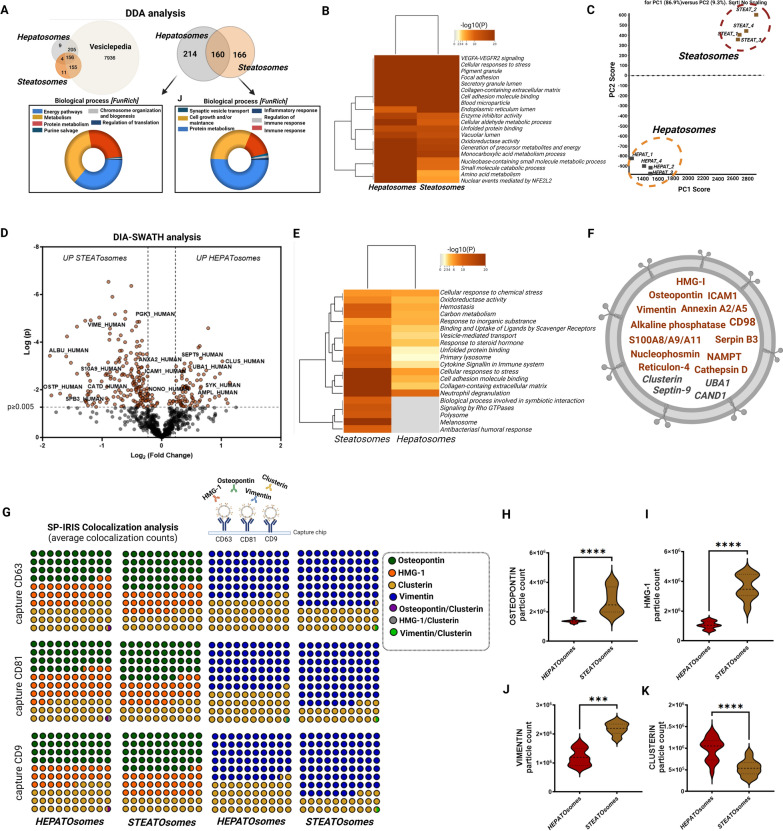
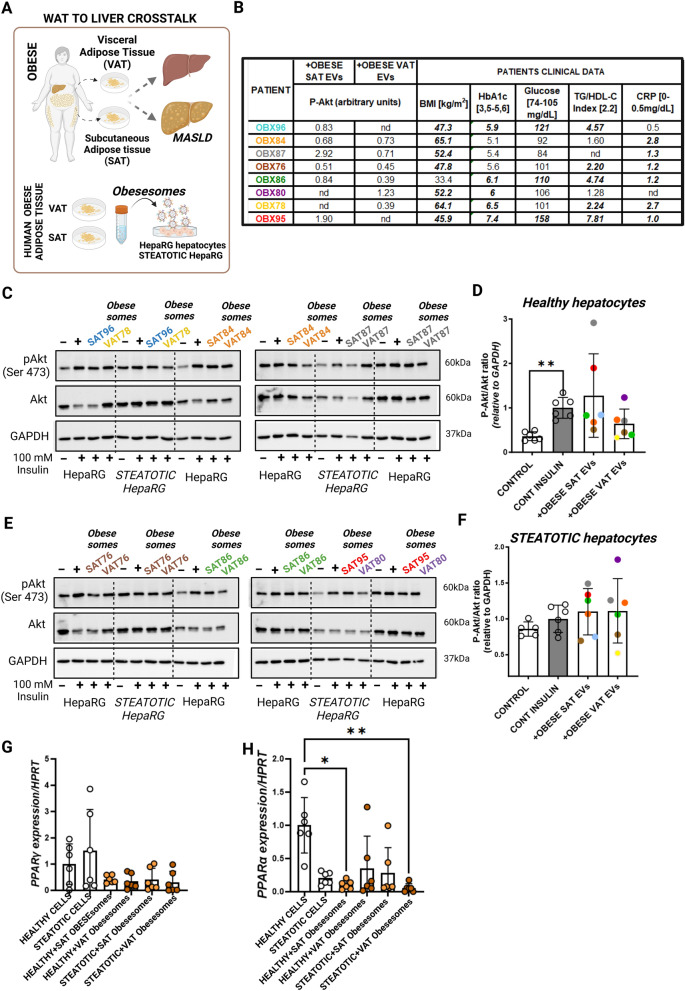
Methods: Extracellular vesicles (EVs) were isolated through serial ultracentrifugation from murine adipocytes treated with palmitate or oleic acid, whole visceral and subcutaneous adipose tissue (obesesomes) of bariatric surgery obese donors, and human hepatocytes under steatosis (steatosomes) for functional in vitro experiments. Functional effects on inflammation and glucose and lipid metabolism of target cells (human and murine macrophages and hepatocytes) were assessed using ELISA, RT-PCR, and immunodetection. Isolated EVs from human steatotic (steatosomes) and control hepatocytes (hepatosomes) were characterized for quantity, size, and tetraspanin profile by NTA and Single Particle Interferometric Reflectance Imaging Sensor (SP-IRIS), and their protein cargo analyzed by qualitative (DDA) and quantitative (DIA-SWATH) proteomics using LC-MS/MS. Proteins identified by proteomics were validated by capturing EVs on functionalized chips by SP-IRIS.

Results and conclusions: In this study, we investigated the role of EVs in the local communication between obese adipocytes and immune cells within adipose tissue, and the interaction of steatotic and healthy hepatocytes in the context of fatty liver disease progression. Furthermore, we analyzed obese adipose tissue-to-liver interactions through EV-obesesomes to elucidate their role in obesity-associated hepatic metabolic dysregulation. Our findings reveal that obesesomes promote inflammation and the secretion of pro-inflammatory cytokines upon interaction with macrophages, exerting a significant impact on reducing insulin resistance and altering lipid and glucose metabolism upon interaction with hepatocytes; in both cases, EVs from palmitate-loaded adipocytes and obesesomes from human visceral adipose depots demonstrated the most deleterious effect. Additionally, EVs secreted by steatotic hepatocytes (steatosomes) induced insulin resistance and altered lipid and glucose metabolism in healthy hepatocytes, suggesting their involvement in MASLD development. Proteomic analysis of steatosomes revealed that these vesicles contain liver disease-associated proteins, rendering them significant repositories of real-time biomarkers for the early stages and progression of MASLD.

Keywords: Extracellular vesicles; Inflammation; Liver steatosis; MASLD; Obesity.


Conflict of interest statement

Declarations. Ethics approval and consent to participate: All human samples and data were obtained after obtaining written informed consent, in accordance with The Code of Ethics of the World Medical Association (Declaration of Helsinki). All procedures were approved by the Clinical Ethical Committee of Galicia (CEIC), Spain, under code number 2020/497. Competing interests: The authors declare that they have no affiliations with or involvement in any organization or entity with any financial interest in the subject matter or materials discussed in this manuscript.

Figures

Fig. 1
Fig. 1
Obesesomes induce macrophage inflammation. EVs isolated from control and pathological adipocytes [high glucose/high insulin (HG/HI), palmitate (PALM) and oleic acid (OLEIC)] were used to treat Raw 264.7 murine macrophages during 24 h (A); cell conditioned medium was collected for assaying 40 cytokine array. Significant changes in fold change towards macrophages treated with control vesicles are represented [densitometry arbitrary units of n = 3 independent experiments] (B). Human obesesomes isolated from obese subcutaneous (SAT) and visceral (VAT) fat explants were used to treat THP-1 human macrophages for 24 h (C); BMI [kg/m2], metabolic syndrome index [TG/HDL-C], type 2 diabetes [HbA1c], and inflammation [CRP] status of adipose tissue donors used for functional assays is shown (D); and relative TNF-α expression in THP-1 represented (E). Differences were analyzed using the Two-Way Anova test, followed by Dunnett's multiple comparisons test (P ≤ 0.05, considered statistically significant: * P < 0.05, ** P < 0.01, *** P < 0.001, and ****P < 0.0001); detailed clinical data of donors are shown in Supplementary Fig. 1, and graphs row data in Supplementary file 9. Figure created using Biorender (https://biorender.com/)
Fig. 2
Fig. 2
Isolation and characterization of hepatosomes and steatosomes. Human hepatocytes were treated with [high glucose/high insulin (HG/HI), palmitate (PALM), oleic acid (OLEIC), or a combination of the three (COMBI)] to establish a steatosis cell model. Representative images of Oil Red O staining used to assess the triglyceride content of cultured hepatocytes (A) and their quantification (B) are shown (n ≥ 4 independent experiments). Western blotting and densitometry (n = 4 independent experiments) of pACC protein levels (C) and insulin sensitivity by immunodetection of p-Akt/Akt after insulin stimulation [100 mM, 10 min; n = 6] are shown (D). NTA quantification [particles/mL] (F) and size distribution [nm] (GH) of isolated extracellular vesicles (n = 3 independent experiments) secreted from heathy (hepatosomes) and from steatotic hepatocytes (COMBI-steatosomes), and tetraspanin profile characterization by SP-IRIS [ExoView R200] is represented indicating interferometric measurement of particles/mL of immuno-captured particles by CD81, CD63 and CD9 (I), representative fluorescent mode images of captured particles for each tetraspanin (red: CD81, green: CD63, and blue: CD9) and colocalization data for each sample is represented in pies (K). Differences were analyzed using One-way Anova Kruskal–Wallis test, followed by Dunn´s multiple comparisons test, One way-Anova followed by Dunnett´s multiple comparisons test, and comparisons between two groups were performed using the Mann–Whitney U test (P ≤ 0.05, considered statistically significant: * P < 0.05, ** P < 0.01, *** P < 0.001, and ****P < 0.0001). Detailed raw data and complete immunoblot images are provided in Supplementary File 9. Figure created using Biorender (https://biorender.com/)
Fig. 3
Fig. 3
Steatosomes alter glucose and lipid metabolism in healthy hepatocytes. Functional assays were performed by incubating steatotic hepatocytes with healthy hepatosomes and healthy hepatocytes with pathological steatosomes [secreted by cells treated with COMBI] for 24 h were performed (A). The effect of EVs was tested using an insulin sensitivity assay by quantifying pAkt/Akt; representative images of n = 6 independent experiments are shown (B, C). Glucose (Glut1) and lipid (FAS, PPARα, PPARγ, and PLIN3) metabolism-regulating gene expression compared to non-treated cells by real-time PCR of n = 6 independent experiments are shown (DH). Differences were analyzed using the one-way ANOVA Kruskal–Wallis test, followed by Dunn´s multiple comparisons test, or by One way-Anova followed by Dunnett´s multiple comparisons test (P ≤ 0.05, considered statistically significant: * P < 0.05, ** P < 0.01, and *** P < 0.001). Detailed raw data and complete immunoblot images are provided in Supplementary File 9. Figure created using Biorender (https://biorender.com/)
Fig. 4
Fig. 4
Proteomic analysis of steatosomes reveals potential MASLD biomarkers. Hepatosomes and steatosomes (n = 4 independent isolation experiments) were analyzed by mass spectrometry using qualitative DDA and quantitative DIA-SWATH analyses. Descriptive and comparative Venn diagrams showing the total number of proteins identified in DDA with FDR < 1% (99% protein confidence), and functional enrichment analysis [FunRich: Biological process] of specific proteins for hepatosomes and steatosomes are shown A. Enrichment analysis [Metascape gene annotation analysis] of the DDA data from the protein content in each vesicle type is represented as a heat map (B). PCA analysis of transformed SWATH areas for the quantitative comparison of hepatosome and steatosome samples (C), and quantitative DIA analysis of proteins identified in steatosomes compared to those in hepatosomes is represented as a volcano plot, x-axis = log2 (fold change), y-axis = log (p-value), indicating significance by dotted line (D). The horizontal dotted line shows the chosen p-value for selecting regulated proteins. Enrichment analysis [Metascape gene annotation analysis] of DIA data from the protein content in each vesicle type represented as a heat map (E), and biomarkers of interest are shown in schematic drawings indicating the elevated proteins in orange and those diminished in gray (F). Validation of selected biomarkers by SP-IRIS is shown as fluorescent mode colocalization (G) and particle counts for osteopontin (H), HMG-1 (I), vimentin (J), and clusterin (K). Differences were analyzed using the Mann–Whitney U test (P ≤ 0.05, considered statistically significant: *** P < 0.001, and ****P < 0.0001). DDA Data-Dependent Acquisition, SWATH Sequential Window Acquisition of All Theoretical Mass Spectra, DIA Data-Independent Acquisition, SP-IRIS Single Particle Interferometric Reflectance Imaging Sensor, HMG High Mobility Group, ICAM Intercellular adhesion molecule, UBA Ubiquitin-Associated, CAND Cullin-associated and neddylation-dissociated. figure created using biorender (https://biorender.com/)
Fig. 5
Fig. 5
Adipose tissue-to-liver crosstalk: Murine obesesomes induce insulin resistance and alter lipid and glucose metabolism in healthy hepatocytes. The effects of obesesomes from lipid-hypertrophied (palmitate/oleic acid) and insulin-resistant (HG/HI) adipocytes on murine primary hepatocytes were assayed by focusing on the insulin pathway (A). Representative images and densitometry of bands expressed towards insulin (10 mM, 5 min stimuli) of pAkt/Akt and pS6/S6 immunoblots [n = 6 independent lysates] are shown (BD). CONT, primary hepatocytes without insulin stimulation; INS, primary hepatocytes stimulated with insulin; PALM/OLEIC, palmitic/oleic-hypertrophied hepatocytes stimulated with insulin; + ADIPO EVs, primary hepatocytes treated with vesicles isolated from control adipocytes; + HGHI EVs, primary hepatocytes treated with obesesomes from insulin-resistant adipocytes (HG/HI); + PALM EVs, primary hepatocytes treated with obesesomes shed by palmitate-hypertrophied adipocytes; + OLEIC EVs, primary hepatocytes treated with obesesomes shed by oleic-hypertrophied adipocytes. Relative expression of lipid [Fatty Acid Synthetase-FAS, Peroxisome Proliferator-Activated Receptor α/γ, perilipin 3] (EH), glucose [PDK1, Glut1] (I, J) metabolism, and inflammation [IL-6, TNF-α] (K, L) genes in primary hepatocytes treated with the above obesesomes (n = 6 independent studies) is represented by histograms. Differences were analyzed using the Kruskal–Wallis test, followed by Dunn´s multiple comparison test (P ≤ 0.05, considered statistically significant; * P < 0.05, ** P < 0.01, and *** P < 0.001). Detailed raw data and complete immunoblot images are provided in Supplementary File 9. Figure created using Biorender (https://biorender.com/)
Fig. 6
Fig. 6
Human obesesomes induce insulin resistance in healthy hepatocytes. Obesesomes isolated from human SAT and VAT explants of independent patients who underwent bariatric surgery (n = 8) were used to treat the human HepaRG control and steatotic hepatocytes (A and B, respectively). Representative images and densitometry of pAkt/Akt to assay insulin resistance upon treatment by stimulating cells with 100 mM insulin for 5 min in healthy adipocytes (C) or steatotic adipocytes (D) are shown. Each patient is represented by a different color, as shown in Table B. Real-time PCR expression analysis of PPARα/γ in treated and non-treated hepatocytes is shown (GH). Differences were analyzed using One-way Anova Kruskal–Wallis test, followed by Dunn´s multiple comparisons test, or One way-Anova followed by Dunnett´s multiple comparisons test (P ≤ 0.05, considered statistically significant: * P < 0.05, ** P < 0.01). SAT, subcutaneous adipose tissue; VAT, visceral adipose tissue. Detailed raw data and complete immunoblot images are shown in Supplementary File 9. Figure created using Biorender (https://biorender.com/)

References

    1. Chait A, den Hartigh LJ. Adipose tissue distribution, inflammation and its metabolic consequences, including diabetes and cardiovascular disease. Front Cardiovasc Med. 2020;7: 522637. - PMC - PubMed
    1. Kivimäki M, Strandberg T, Pentti J, Nyberg ST, Frank P, Jokela M, et al. Body-mass index and risk of obesity-related complex multimorbidity: an observational multicohort study. Lancet Diabetes Endocrinol. 2022;10:253–63. - PMC - PubMed
    1. Francque SMA, Dirinck E. NAFLD prevalence and severity in overweight and obese populations. Lancet Gastroenterol Hepatol. 2023;8:2–3. - PubMed
    1. Wellen KE, Hotamisligil GS. Obesity-induced inflammatory changes in adipose tissue. J Clin Invest. 2003;112:1785–8. - PMC - PubMed
    1. Tanaka M, Nozaki M, Fukuhara A, Segawa K, Aoki N, Matsuda M, et al. Visfatin is released from 3T3-L1 adipocytes via a non-classical pathway. Biochem Biophys Res Commun. 2007;359:194–201. - PubMed

LinkOut - more resources