. 2025 Feb 20;13(1):30.
doi: 10.1186/s40364-025-00744-8.

Multiple regulatory events contribute to a widespread circular RNA downregulation in precancer and early stage of colorectal cancer development

Affiliations

Multiple regulatory events contribute to a widespread circular RNA downregulation in precancer and early stage of colorectal cancer development

Alessandro Camandona et al. Biomark Res. .

Abstract

Background: Early detection of colorectal cancer (CRC) significantly improves its management and patients' survival. Circular RNAs (circRNAs) are peculiar covalently closed transcripts involved in gene expression modulation whose dysregulation has been extensively reported in CRC cells. However, little is known about their alterations in the early phases of colorectal carcinogenesis.

Methods: In this study, we performed an integrative analysis of circRNA profiles in RNA-sequencing (RNA-Seq) data of 96 colorectal cancers, 27 adenomas, and matched adjacent mucosa tissues. We also investigated the levels of cognate linear transcripts and those of regulating RNA-binding proteins (RBPs). Levels of circRNA-interacting microRNAs (miRNAs) were explored by integrating data of small RNA-Seq performed on the same samples.

Results: Our results revealed a significant dysregulation of 34 circRNAs (paired adj. p < 0.05), almost exclusively downregulated in tumor tissues and, prevalently, in early disease stages. This downregulation was associated with decreased expression of circRNA host genes and those encoding for RBPs involved in circRNA biogenesis, including NOVA1, RBMS3, and MBNL1. Guilt-by-association analysis showed that dysregulated circRNAs correlated with increased predicted activity of cell proliferation, DNA repair, and c-Myc signaling pathways. Functional analysis showed interactions among dysregulated circRNAs, RBPs, and miRNAs, which were supported by significant correlations among their expression levels. Findings were validated in independent cohorts and public datasets, and the downregulation of circLPAR1(2,3) and circLINC00632(5) was validated by ddPCR.

Conclusions: These results support that multiple altered regulatory mechanisms may contribute to the reduction of circRNA levels that characterize early colorectal carcinogenesis.

Keywords: Adenoma; Circular RNAs; Colorectal cancer; Precancerous lesions; RNA-binding proteins; RNA-sequencing.


Conflict of interest statement

Declarations. Ethics approval and consent to participate: The local ethics committees of Azienda Ospedaliera SS. Antonio e Biagio e C. Arrigo of Alessandria (Italy, protocol no. Colorectal miRNA CEC2014), Masaryk Memorial Cancer Institute (protocol no. 2018/865/MOU), and Masaryk University of Brno (Czech Republic, protocol no. EKV2019-044) approved the study. All patients gave written informed consent following the Declaration of Helsinki before participating in the study. Consent for publication: All authors read and approved the final manuscript. Competing interests: The authors declare no competing interests.

Figures

Fig. 1
Fig. 1
Summary of the study design reporting the sample size and workflow of the analyses
Fig. 2
Fig. 2
CircRNA levels are depleted in lesion samples with respect to adjacent mucosa. A Volcano plots of the circRNA paired differential analysis reporting on the y-axis the -log10 adj. p-value and on the x-axis the extent of expression change (as log2FC) between lesion (adenoma on the left, and tumor on the right) and adjacent mucosa samples. Dot size is proportional to circRNA median expression. The red dashed line indicates the adj. p-value threshold of 0.05. Black dot border highlights the differentially expressed circRNAs. The labels identify the most significant up or downregulated circRNAs identified in adenoma and tumor analyses. B Scatter plot of the correlation levels of differentially expressed circRNAs between log2FC computed in the analysis of adenoma and tumor samples. C Boxplots reporting the concentration (copies/μL) of selected circRNAs in lesion and adjacent tissue samples measured by ddPCR (*p < 0.05 by Paired Wilcoxon Rank-Sum test). D Heatmap of the hierarchical clustering analysis of Z-score-normalized circRNA levels in all the analyzed samples. E Dot plot of circRNA differential expression analysis between lesions (adenoma (left) and CRC (right)) and their corresponding adjacent mucosa in patients stratified for different clinical and molecular data. Dot size is proportional to p-value, while the color code reflects the log2FC expression levels
Fig. 3
Fig. 3
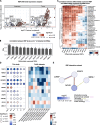
CircRNA host genes are downregulated in tumor tissues. A Volcano plots of the differential expression analysis of the differentially expressed circRNA host genes levels in lesions with respect to adjacent mucosa. Red dashed line indicates adj. p < 0.05. Black border identifies significant results. B Scatter plots of the relationships between log2FCs computed for the differentially expressed circRNAs and their host genes. The label highlights the most significant up/downregulated circRNA host genes. C Dot plot of the differential expression of circRNA host gene levels between lesions and adjacent mucosa samples in patients stratified according to disease stage. The dot size is proportional to the analysis significance. On the right, bar plot of the results of the Spearman correlation analysis between circRNA and their host gene levels. *p < 0.05; ***p < 0.001. D Heatmap reporting the differences in circRNA host gene levels (log2FC) between lesions and adjacent mucosa considering samples from ten public independent datasets
Fig. 4
Fig. 4
RNA-binding proteins involved in circRNA biogenesis are downregulated in tumor tissue. A Volcano plot of the differential expression analysis of RBP gene levels between lesions and adjacent mucosa. Black border highlights the significant results, while labels highlight the 11 RBPs whose levels significantly correlated with the number of detected circRNAs. B Bar plot of the correlation between differentially expressed RBP gene levels and the number of detected circRNAs in each sample. *p < 0.05; **p < 0.01. C Heatmap of the correlation between levels of RBP genes and those of the differentially expressed circRNAs. *p < 0.05; **p < 0.01; ***p < 0.001. D Dot plot of the differential expression of RBP genes between lesion and adjacent mucosa stratified according to disease stage. Size is proportional to the analysis significance. On the right, the heatmap reports the results of the differential expression analysis (log2FC) computed using 10 independent public datasets. *p < 0.05; **p < 0.01; ***p < 0.001. E Interaction network of circRNA-correlated RBPs. Node color reflects the log2FC from the differential expression analysis, while the link color identifies the type of supporting evidence
Fig. 5
Fig. 5
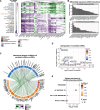
Dysregulated circRNA levels inversely correlate with proliferation-related pathways. A Bar plot of the log2FC of MSigDB hallmark gene set scores computed between lesions and adjacent mucosa samples (left) and heatmap of the correlation between differentially expressed circRNA levels and hallmark pathway scores (right; *p < 0.05). The heatmap color gradient reflects the correlation coefficient (green for negatively correlated and purple for positively correlated). B Bar plot reporting the number of interactions with RBPs (up) and miRNAs (down) predicted for each dysregulated circRNA. C Circos plot of the significant and coherent correlations between differentially expressed circRNAs and interacting miRNAs and RBP genes (blue, red, and orange arches, respectively). Edge color and intensity reflect the correlation coefficient. D Volcano plot of the differential levels of miRNAs interacting with circRNAs when analyzed in lesions compared to adjacent mucosa. Labeled dots identify the differentially expressed miRNAs. The red dashed line indicates adj. p < 0.05. E Dot plot of hallmark gene set enrichment analysis considering the validated targets of dysregulated miRNAs interacting with circRNAs. The dot size is proportional to the number of target genes, while the color reflects the predicted pathway activation levels (Coefficient)

References

    1. Siegel RL, Wagle NS, Cercek A, Smith RA, Jemal A. Colorectal cancer statistics, 2023. CA Cancer J Clin. 2023;73(3):233–54. - PubMed
    1. Dekker E, Tanis PJ, Vleugels JLA, Kasi PM, Wallace MB. Colorectal cancer. Lancet. 2019;394(10207):1467–80. - PubMed
    1. Nunes L, Li F, Wu M, Luo T, Hammarstrom K, Torell E, Ljuslinder I, Mezheyeuski A, Edqvist PH, Lofgren-Burstrom A, et al. Prognostic genome and transcriptome signatures in colorectal cancers. Nature. 2024;633(8028):137–46. - PMC - PubMed
    1. Dienstmann R, Vermeulen L, Guinney J, Kopetz S, Tejpar S, Tabernero J. Consensus molecular subtypes and the evolution of precision medicine in colorectal cancer. Nat Rev Cancer. 2017;17(2):79–92. - PubMed
    1. Pisignano G, Michael DC, Visal TH, Pirlog R, Ladomery M, Calin GA, Pisignano G, Michael DC, Visal TH, Pirlog R, et al. Going circular: history, present, and future of circRNAs in cancer. Oncogene. 2023;42(38):2783–800. - PMC - PubMed

LinkOut - more resources