. 2025 Feb;14(4):e70472.
doi: 10.1002/cam4.70472.

A Novel Molecular Profile of Hormone-Sensitive Prostate Cancer Defines High Risk Patients

Affiliations

A Novel Molecular Profile of Hormone-Sensitive Prostate Cancer Defines High Risk Patients

Claudia Piombino et al. Cancer Med. 2025 Feb.

Abstract

Background: The therapeutic management of metastatic hormone-sensitive prostate cancer (mHSPC) is still based on clinical and pathological parameters due to the lack of biomarkers that may drive tailored treatment.

Methods: In this non-randomized, single-center, retrospective trial, we searched for a genetic signature using the NanoString nCounter PanCancer Pathways Panel on formalin-fixed paraffin embedded prostate cancer samples belonging to 48 patients with de novo or relapsed mHSPC. Patients were divided into a high-clinical-risk group (n = 36) and a low-clinical-risk group (n = 12) according to the mean time to metastatic relapse.

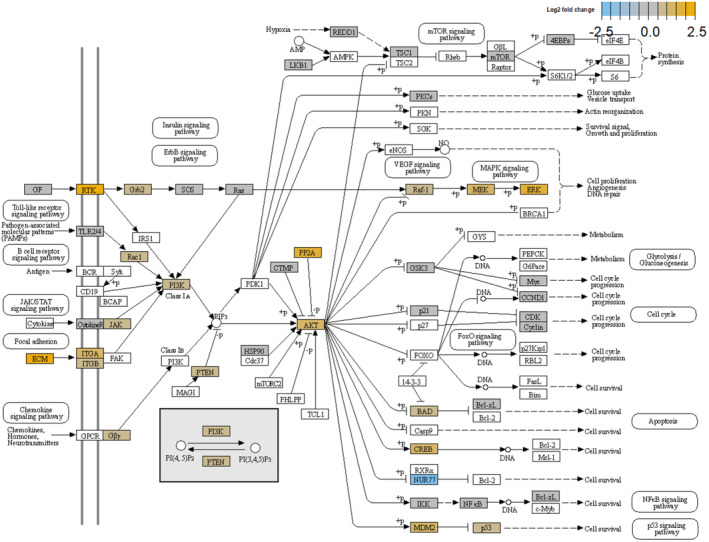
Results: The analysis of Nanostring nCounter Panel data revealed differential expression of 42 genes between high-clinical-risk and low-clinical-risk groups. All the genes except for NR4A1 and FOS were upregulated in the high-clinical-risk group. A general overexpression of apoptosis, PI3K and MAPK pathway-related genes, including AKT2, was observed in the high-clinical-risk group.

Conclusion: The differential genetic signature identified between the two study groups revealed novel biomarkers in mHSPC, additionally suggesting new therapeutic targets within the hormone sensitive phase, such as AKT2. Further prospective larger cohort studies are needed to assess the prognostic value of our findings and their exact role in prostate cancer progression.

Keywords: AKT2; FOS; NR4A1; NanoString nCounter PanCancer Pathways Panel; metastatic hormone‐sensitive prostate cancer.


Conflict of interest statement

The authors declare no conflicts of interest.

Figures

FIGURE 1
FIGURE 1
Survival analysis: (A) PFS1 in the low‐clinical‐risk group vs. the high‐clinical‐risk group, (B) PFS1 according to first‐line therapy in the high‐clinical‐risk group, and (C) OS in the low‐clinical‐risk group vs. the high‐clinical‐risk group.
FIGURE 2
FIGURE 2
Volcano plot of the PanCancer Pathway gene panel. Volcano plot allows to evaluate for each target gene (represented by a dot) the different expression in the two groups (log2‐fold change, on the x‐axis) and its level of significance (−log10 p‐value, on the y‐axis). The horizontal lines represent the thresholds of adjusted (adj) p‐values according to Benjamini–Yekutieli. The overexpressed targets in the high‐clinical‐risk group compared to the low‐clinical‐risk group are on the right side (positive log2‐fold change), while the downregulated targets are on the left side (negative log2‐fold change). The more the target is in the upper part, the greater the statistical significance. The color of the dots reflects the level of statistical significance: white dots represent genes not significantly differentially expressed between the two groups, while colored dots represent genes significantly differentially expressed between the two groups (adj p‐value < 0.05). Among colored dots, the lighter the color, the greater the statistical significance.
FIGURE 3
FIGURE 3
Volcano plots for selected gene sets. The genes included in the set are represented by yellow squares, while dots represent other genes included in the PanCancer Pathway gene panel (white dots: genes not significantly differentially expressed between the two groups; gray dots: genes significantly differentially expressed between the two groups). (A) Apoptosis gene set. The only downregulated gene in the high‐clinical‐risk group is GADD45B, without reaching the statistical significance. All targets with significant differences in expression are upregulated in the high‐risk clinical group: SKP1 (p = 8.86 × 10−6), MDM2 (p = 9.04 × 10−6), WEE1 (p = 3.89 × 10−5), STAG2 (p = 1.03 × 10−4), RAD21 (p = 1.32 × 10−4), CUL1 (p = 1.66 × 10−4), PRKACA (p = 2.13 × 10−4), BAX (p = 2.66 × 10−4), AKT2 (p = 4.23 × 10−4), and TNFSF10 (p = 4.53 × 10−4). (B) Driver gene set. The only downregulated gene in the high‐clinical‐risk group is KLF4, which does not reach the statistical significance. All targets with significant differences in expression are upregulated in the high‐clinical‐risk group: CTNNB1 (p = 2.67 × 10−9), HIST1H3B (p = 8.85 × 10−8), SF3B1 (p = 4.77 × 10−7), and NF1 (p = 1.20 × 10−6). (C) MAPK gene set. NR4A1 (p = 1.29 × 10−9) and FOS (p = 9.24 × 10−4) are downregulated in the high‐clinical‐risk group; MAPK1 (p = 3.30 × 10−7), NF1 (p = 1.20 × 10−6), STMN1 (p = 1.08 × 10−5), PDGFRB (p = 3.79 × 10−5), PRKACA (p = 2.13 × 10−4), GRB2 (p = 3.17 × 10−4), and AKT2 (p = 4.23 × 10−4) are upregulated in the high‐clinical‐risk group. (D) PI3K gene set. MDM2 is overexpressed (p = 9.04 × 10−6) and NR4A1 is downregulated (p = 1.29 × 10−9) in the high‐clinical‐risk group. (E) Transcriptional mis‐regulation gene set. All targets of the gene set are overexpressed in the high‐clinical‐risk group: HIST1H3B (p = 8.85 × 10−8), H3F3C (p = 2.13 × 10−6), MDM2 (p = 9.04 × 10−6), HIST1H3H (p = 5.90 × 10−5), H3F3A (p = 2.88 × 10−4), and NCOR1 (p = 3.96 × 10−4). (F) WNT gene set. CTNNB1 (p = 2.67 × 10−9), SKP1 (p = 8.86 × 10−6), WNT5A (p = 4.05 × 10−5), SFRP2 (p = 1.22 × 10−4), TBL1XR1 (p = 1.62 × 10−4), and CUL1 (p = 1.66 × 10−4) are upregulated in the high‐clinical‐risk group.
FIGURE 4
FIGURE 4
PI3K‐AKT signaling pathway by nSolver Software (PathView). The PI3K‐AKT signaling pathway has pleiotropic effects on both normal and cancerous cellular processes, including but not limited to cell migration, survival, growth, proliferation, and metabolism. PI3K upstream activates AKT by generating PIP3, while PTEN is a negative regulator reverting PIP3 to PIP2. Multiple kinases, such as PDK1 and mTORC2, activate AKT, stimulating cell survival and proliferation and promoting tumor growth. BAD, FOXOs, and MDM2 are just some of the downstream targets of AKT. By contrast, AKT is negatively regulated by several proteins, such as PP2A and PHLPP. The colored proteins are those encoded by significantly differentially expressed genes between the two groups in our study. The different color indicates the different level of expression (log2‐fold change) of the target gene in the high‐clinical‐risk group compared to the low‐clinical‐risk group.

References

    1. Leung J. K. and Sadar M. D., “Non‐Genomic Actions of the Androgen Receptor in Prostate Cancer,” Frontiers in Endocrinology 8 (2017): 2, 10.3389/fendo.2017.00002. - DOI - PMC - PubMed
    1. Sartor O. and de Bono J. S., “Metastatic Prostate Cancer,” New England Journal of Medicine 378, no. 7 (2018): 645–657, 10.1056/NEJMra1701695. - DOI - PubMed
    1. Aurilio G., Cimadamore A., Mazzucchelli R., et al., “Androgen Receptor Signaling Pathway in Prostate Cancer: From Genetics to Clinical Applications,” Cells 9, no. 12 (2020): 2653, 10.3390/cells9122653. - DOI - PMC - PubMed
    1. Ng K., Smith S., and Shamash J., “Metastatic Hormone‐Sensitive Prostate Cancer (mHSPC): Advances and Treatment Strategies in the First‐Line Setting,” Oncology and Therapy 8, no. 2 (2020): 209–230, 10.1007/s40487-020-00119-z. - DOI - PMC - PubMed
    1. Hahn A. W., Hale P., Rathi N., and Agarwal N., “Novel Androgen Axis Systemic Therapies for Metastatic Hormone‐Sensitive Prostate Cancer,” Current Opinion in Urology 27, no. 6 (2017): 559–565, 10.1097/MOU.0000000000000443. - DOI - PubMed

Substances