. 2025 Feb;13(4):e70253.
doi: 10.14814/phy2.70253.

Lung-delivered IL-10 mitigates Lung inflammation induced by repeated endotoxin exposures in male mice

Affiliations

Lung-delivered IL-10 mitigates Lung inflammation induced by repeated endotoxin exposures in male mice

Aaron D Schwab et al. Physiol Rep. 2025 Feb.

Abstract

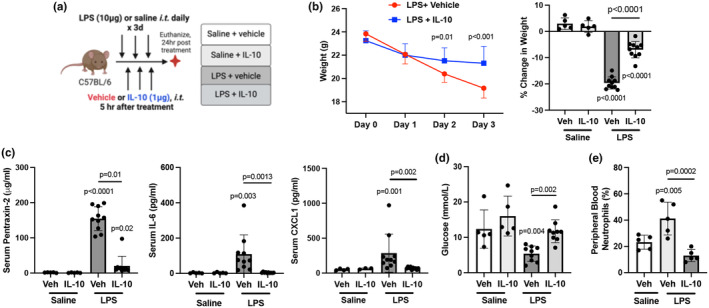
Therapies capable of resolving inflammatory lung disease resulting from high-consequence occupational/environmental hazards are lacking. This study seeks to determine the therapeutic potential of direct lung-delivered interleukin (IL)-10 following repeated lipopolysaccharide exposures. C57BL/6 mice were intratracheally instilled with LPS (10 μg) and treated with IL-10 (1 μg) or vehicle control for 3 days. Lung cell infiltrates were enumerated by flow cytometry. Lung sections were stained for myeloperoxidase (MPO), CCR2, vimentin, and post-translational protein citrullination (CIT) and malondialdehyde-acetaldehyde (MAA) modifications. Lung function testing and longitudinal in vivo micro-CT imaging were performed. Whole lungs were profiled using bulk RNA sequencing. IL-10 treatment reduced LPS-induced weight loss, pentraxin-2, and IL-6 serum levels. LPS-induced lung proinflammatory and wound repair mediators (i.e., TNF-α, IL-6, CXCL1, CCL2, MMP-8, MMP-9, TIMP-1, fibronectin) were decreased with IL-10. IL-10 reduced LPS-induced influx of lung neutrophils, CD8+ T cells, NK cells, recruited monocyte-macrophages, monocytes, and tissue expression of CCR2+ monocytes-macrophages, MPO+ neutrophils, vimentin, CIT, and MAA. IL-10 reduced LPS-induced airway hyperresponsiveness and improved lung compliance. Micro-CT imaging confirmed the reduction in LPS-induced lung density by IL-10. Lung-delivered IL-10 therapy administered after daily repeated endotoxin exposures strikingly reduces lung inflammatory and wound repair processes to decrease lung pathologic changes and mitigate airway dysfunction.

Keywords: endotoxin; environmental lung disease; inflammation; macrophages; occupational.


Conflict of interest statement

JAP has received research reagents (anti‐IL‐33/ST2 blocking antibody reagent, no monies) from AstraZeneca. JAP is a site recruiter for clinical industry studies for asthma, sinus disease, and urticaria (GlaxoSmithKline, AstraZeneca, Regeneron Pharmaceuticals, CellDex Therapeutics). TRM has consulted for Horizon Therapeutics, Otaltech Therapeutics, Pfizer, and UCB and receives research support from Horizon.

Figures

FIGURE 1
FIGURE 1
Lung‐delivered IL‐10 administered after LPS exposures reduces repeated LPS‐induced weight loss and systemic inflammatory responses. (a) Mice were treated with LPS or saline daily for 3 days and received either treatment with IL‐10 (10 μg) or vehicle (veh) daily for 3 days administered 5 h after LPS or saline and were euthanized at 24 h after the final treatment. (b) Line graph depicts weights over time with scatter dot plot demonstrating percent change in weight upon study completion across indicated groups. (c) Acute phase protein pentraxin‐2, IL‐6, and neutrophil chemoattractant CXCL were quantified in serum across indicated groups. (d) Blood glucose levels and (e) peripheral blood neutrophils by percentage were quantified across indicated groups. All data expressed as mean with SD bars of n = 5 mice/saline exposed groups; n ≥ 8 mice/LPS exposed groups. Statistical significance by p‐values versus Sal+Veh (no line) or denoted between groups by line.
FIGURE 2
FIGURE 2
LPS‐induced airway and lung tissue inflammatory mediator release is reduced by treatment with localized, lung‐delivered IL‐10. (a) Bronchoalveolar lavage fluid (BALF) and (b) lung tissue homogenates utilized to quantify levels of inflammatory cytokines (TNF‐⍺, IL‐6), chemokines (CXCL1, CCL2), and IL‐10 across indicated groups. (c) Quantification of lung levels of extracellular matrix proteins (MMP‐8, MMP‐9, TIMP‐1), fibronectin, and complement component C5a across indicated groups. All data are expressed in scatter dot plots with mean and SD bars of n = 5 mice/saline exposed groups; n = 10 mice/LPS exposed groups. Statistical significance is denoted by p‐values versus Sal+Veh (no line) or denoted between groups by line.
FIGURE 3
FIGURE 3
Localized, lung‐administered IL‐10 inhibits LPS‐induced lung dysfunction and lung cellular infiltrates. (a) Airway hyper‐responsiveness expressed as total lung resistance (RL) and dynamic compliance (Cdyn) were measured following escalating doses of aerosolized methacholine between LPS‐exposed mice treated with IL‐10 versus vehicle. (b) BALF total cell numbers across groups. (c) Total lung cells of mice exposed to LPS or saline and treated with IL‐10 versus vehicle control were enumerated. (d) Lung immune cell infiltrates were determined by flow cytometry on live CD45+ cells after exclusion of debris and doublets across indicated groups, with lung cell % population in respective gate multiplied by total lung cells. Cells were defined as CD11cLy6G+ neutrophils, CD3+CD8+ T cells, natural killer (NK) cells, and innate immune CD19+CD11b+ B cells. Gating strategy is depicted in Figure E1/online repository. (e) Gating strategy of monocyte–macrophage (Mɸ) subpopulations based upon CD11c and CD11b expression (f) Monocyte‐Mɸ infiltrates are depicted across treatment groups and defined as resting alveolar Mɸ (CD11c+CD11b), activated alveolar Mɸ (CD11c+CD11b+), recruited/transitional monocyte/Mɸ (CD11cintCD11b+), and monocytes (CD11cCD11b+). All data are expressed in scatter dot plots with mean and SD bars of n = 5 mice/saline‐exposed groups; n = 10 mice/LPS‐exposed groups. Statistical significance is denoted by p‐values versus Sal+Veh (no line) or denoted between groups by line.
FIGURE 4
FIGURE 4
Repeated LPS‐exposure induced adverse lung histopathology, neutrophil and CCR2+ cell infiltrates, vimentin accumulation and expression of post‐translationally modified proteins are inhibited with lung‐administered IL‐10 therapy. (a) Representative lung sections for indicated groups stained for H&E, myeloperoxidase (MPO, red), CCR2 (red), vimentin (green), citrulline (CIT, green), and malondialdehyde‐acetaldehyde (MAA, red)‐adducted proteins with DAPI nuclei staining (blue) by confocal microscopy. Line scale denotes 100 μm. (b) Semi‐quantitative inflammatory score across indicated groups. (c–g) Integrated density of MPO, CCR2, vimentin, CIT‐ and MAA‐modified proteins quantified per each mouse. All data expressed in scatter dot plots with mean and SD bars of n = 5 mice/saline‐groups; n = 10 mice/LPS‐groups. Statistical significance denoted by p‐values versus Sal+Veh (no line) or denoted between groups by line.
FIGURE 5
FIGURE 5
Localized IL‐10 therapy modulates transcriptome of lung tissue following repeated LPS exposure. (a) Volcano plot demonstrates statistical significance (−log10 (p‐value)) versus magnitude of change (log2 fold change) in expression of specified gene transcripts (−log10 (p‐value) >1.3) with red reflecting upregulated and blue reflecting downregulated genes. (b) Heatmap demonstrates hierarchical clustering of the 25 most upregulated and downregulated genes and relative frequencies of genes subjected to symmetric normalization of log2 (transcripts per million [TPM] + 0.0001) for all significant genes (adj p < 0.05) to avoid any nonsense values. The color scheme represents symmetric normalization of relative frequencies from high expression (red) to low expression (blue). (c) Chord plots demonstrate the top canonical pathways of the whole lung transcriptome based on Ingenuity Pathway Analysis (IPA) output and the corresponding fold change for the top upregulated and downregulated genes (p < 0.05) associated with each modulated pathway. n = 3 mice/treatment group.
FIGURE 6
FIGURE 6
Localized lung IL‐10 therapy inhibition of adverse LPS‐induced experimental endpoints persists without rebound after 1 week. (a) Mice were treated with LPS for 3 days and received either treatment with IL‐10 (10 μg) or vehicle (veh) for 3 days and subsequently rested for 1 week prior to study completion. (b) Line graph depicts weights over time between IL‐10 and vehicle‐treated LPS‐exposed animals. (c) Serum levels of acute phase protein pentraxin‐2 between groups. (d) BALF total cell numbers are reduced with IL‐10 therapy. (e) LPS‐induced lung cell infiltrates including total lung cells, activated macrophages (Mɸ), recruited/transitioning monocytes/Mɸ, monocytes, and innate CD19 + CD11b + B cells remain reduced with IL‐10 versus vehicle treatment. (f) Lung levels of LPS‐induced chemokines (CXCL1, CCL2), fibronectin, matrix metalloproteinase (MMP)‐9, and complement component C5a are reduced with IL‐10 therapy. Lung levels of IL‐10 remain increased with IL‐10 therapy at 1 week. All data expressed as mean with SD bars of n = 10 mice/LPS‐exposed groups. Statistical significance denoted by p‐values between groups.
FIGURE 7
FIGURE 7
Localized lung IL‐10 therapy protects against LPS‐induced lung inflammatory pathology over time. Mice were treated with LPS for 3 days and received either treatment with IL‐10 (10 μg) or vehicle (veh) for 3 days and subsequently rested for 5 days. (a) Representative H&E images from each treatment group. (b) Scatter dot plot depicts semi‐quantitative lung inflammatory score between groups. (c) Representative micro‐CT image at baseline, day 5, and day 8 of the same mouse with the density of lung tissues demonstrated by a colored range of Hounsfield units. (d) Line graph of the mean with SD bar of all mice depicted by averaged Hounsfield units per mouse (top graph) and percent change to baseline per mouse (bottom graph). All data are expressed as mean with SD bars of n = 5 mice/group. Statistical significance is denoted by p‐values between groups.

References

    1. Albright, M. , Guttenberg, M. A. , & Tighe, R. M. (2022). Ozone‐induced models of airway Hyperreactivity and epithelial injury. Methods in Molecular Biology, 2506, 67–81. - PubMed
    1. Bauer, C. D. , Mosley, D. D. , Samuelson, D. R. , Poole, J. A. , Smith, D. R. , Knoell, D. L. , & Wyatt, T. A. (2024). Zinc protects against swine barn dust‐induced cilia slowing. Biomolecules, 14(7), 843. - PMC - PubMed
    1. Benjamini, Y. , & Hochberg, Y. (1995). Controlling the false discovery rate: A practical and powerful approach to multiple testing. Journal of the Royal Statistical Society: Series B: Methodological, 57(1), 289–300.
    1. Blazquez‐Prieto, J. , Lopez‐Alonso, I. , Huidobro, C. , & Albaiceta, G. M. (2018). The emerging role of neutrophils in repair after acute Lung injury. American Journal of Respiratory Cell and Molecular Biology, 59(3), 289–294. - PubMed
    1. Brandenberger, C. , & Muhlfeld, C. (2017). Mechanisms of lung aging. Cell and Tissue Research, 367(3), 469–480. - PubMed