. 2025 Aug;19(8):2366-2387.
doi: 10.1002/1878-0261.13806. Epub 2025 Feb 20.

MET variants with activating N-lobe mutations identified in hereditary papillary renal cell carcinomas still require ligand stimulation

Affiliations

MET variants with activating N-lobe mutations identified in hereditary papillary renal cell carcinomas still require ligand stimulation

Célia Guérin et al. Mol Oncol. 2025 Aug.

Abstract

In hereditary papillary renal cell carcinoma (HPRCC), the hepatocyte growth factor receptor (MET) receptor tyrosine kinase (RTK) mutations recorded to date are located in the kinase domain and lead to constitutive MET activation. This contrasts with MET mutations identified in non-small-cell lung cancer (NSCLC), which lead to exon 14 skipping and deletion of a regulatory domain: In this latter case, the mutated receptor still requires ligand stimulation. Sequencing of MET in samples from 158 HPRCC and 2808 NSCLC patients revealed 10 uncharacterized mutations. Four of these, all found in HPRCC and leading to amino acid substitutions in the N-lobe of the MET kinase, proved able to induce cell transformation, which was further enhanced by hepatocyte growth factor (HGF) stimulation: His1086Leu, Ile1102Thr, Leu1130Ser, and Cis1125Gly. Similar to the variant resulting in MET exon 14 skipping, the two N-lobe MET variants His1086Leu and Ile1102Thr were found to require stimulation by HGF in order to strongly activate downstream signaling pathways and epithelial cell motility. The Ile1102Thr mutation also displayed transforming potential, promoting tumor growth in a xenograft model. In addition, the N-lobe-mutated MET variants were found to trigger a common HGF-stimulation-dependent transcriptional program, consistent with an observed increase in cell motility and invasion. Altogether, this functional characterization revealed that N-lobe variants still require ligand stimulation, in contrast to other RTK variants. This suggests that HGF expression in the tumor microenvironment is important for tumor growth. The sensitivity of these variants to MET inhibitors opens the way for use of targeted therapies for patients harboring the corresponding mutations.

Keywords: MET; cancer; hepatocyte growth factor; hereditary papillary renal cancer; receptor tyrosine kinase; somatic mutations.


Conflict of interest statement

The authors declare no conflict of interest.

Figures
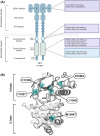
Fig. 1
Fig. 1
Schematic representation of MET variants. (A) Representation of novel MET mutations in the SEMA domain, the juxtamembrane domain, and the tyrosine kinase domain, identified in HPRCC (in purple) and NSCLC (in blue). (B) Crystal structure of the human MET kinase domain (PDB 2G15). Highlighted are, on the one hand, the documented activating mutation M1268T in the C‐lobe of the kinase and, on the other hand, the novel N‐lobe mutations characterized in this study, analyzed through pymol (Mannheim, Germany).
Fig. 2
Fig. 2
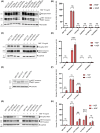
In vitro transforming ability assays performed on cells expressing different mutated MET cDNAs in the absence and presence of exogenous HGF. Western blot showing transient MET expression (A, C, E, G) and diagrams showing the average number of clones per Petri dish (B, D, F, H) of NIH3T3 cells transfected with a vector encoding either wild‐type (WT) MET, MET p.(Met1268Thr) (positive control), or a novel MET variant. (A, B) Results for MET p.(Val37Ala), MET p.(Arg426Pro), MET p.(His1097Arg) and MET p.(Asp1249Glu). (C, D) Results for MET p.(Ser1018Pro) and MET p.(Gly1056Glu). (E, F) Results for MET p.(Leu1130Ser). (G, H) Results for MET p.(Cys1125Gly), Ile1102Thr and MET p.(His1086Leu). For Western botting, cells were stimulated 30 min by 30 ng·mL−1 HGF. For foci formation assay, cells were treated all along the culture by 10 ng·mL−1 HGF. n = 3; mean ± SEM; representative of three independent experiments. Statistical analysis by two‐way ANOVA, **P‐value < 0.0021; ***P‐value < 0.0002.
Fig. 3
Fig. 3
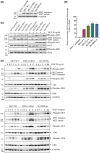
MET TKI sensitivity and inhibition of downstream signaling pathways in transiently tranfected NIH3T3 cells expressing different MET variants. Western blot showing the MET activity (phospho‐MET and MET) upon TKI treatment (Tyrosine Kinase inhibitor crizotinib, merestinib, or capmatinib at the indicatd concentration for 1.5 h), prior stimulation or not 30 min by 30 ng·mL−1 HGF of NIH3T3 cells expressing either MET p.(His1086Leu) (H1086L), MET p.(Ile1102Thr) (I1102T), MET p.(Cys1125Gly) (C1125G), or MET p.(Leu1130Ser) (L1130S), as compared to cells expressing the wild‐type MET and to control cells expressing MET p.(Met1268Thr) (M1268T) or METex14Del. GAPDH expression was studied as quality control to validate the experiment. (A, B) MET activity of the I1102T, C1125G and L1130S MET mutants after crizotinib treatment. (C, D) MET activity of the I1102T, C1125G, and L1130S MET mutants after merestinib treatment. (E, F) MET activity of the I1102T, C1125G, and L1130S MET mutants after capmatinib treatment. (G) MET activity of the H1086L MET mutant after crizotinib, merestinib or capmatinib treatment. These western blots are representative of three independent experiments.
Fig. 4
Fig. 4
MET expression in MCF‐7 cells as determined by western blotting and qPCR. Downstream signaling pathway activation in MCF‐7 cells. (A) MCF‐7 cells expressing wild‐type (WT) or mutated MET were plated at 250 000 cells and lysed 24 h later. MET levels were determined by western blotting with the indicated antibodies. GAPDH was used as loading control. (B) MET expression was also validated by RT‐qPCR. 250 000 cells were seeded and 24 h later, total RNA was extracted and complementary DNA (cDNA) was obtained with a reverse transcriptase kit. n = 3; mean ± SEM. (C) MCF‐7 cells were incubated overnight in serum‐free medium and stimulated or not for 30 min with 30 ng·mL−1 HGF prior to cell lysis. Levels and phosphorylation of MET, AKT, and ERK, were determined by western blotting with the indicated antibodies. ERK was used as loading control. (D) MCF‐7 cells were incubated overnight in serum‐free medium and stimulated or not for 30 min, 2 h, 4 h or 8 h with 30 ng·mL−1 HGF prior to cell lysis. Levels and phosphorylation of MET, AKT, and ERK were determined by western blotting with the indicated antibodies. ERK and GAPDH were used as loading control. The western blots are representative of three independent experiments.
Fig. 5
Fig. 5
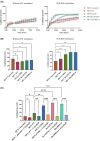
Migration prompted by HGF‐stimulated MET mutants in MCF‐7 cells. (A) MCF‐7 cells were seeded at 30 000 cells per well in a 96‐well plate. Twenty‐four hours later, mitomycin C (10 μg·mL−1) was added for 2 h to stop proliferation. Then a scratch wound was performed with the woundmaker tool and cells were stimulated or not with HGF at 10 ng·mL−1. Pictures were taken every 3 h for 96 h. Data are expressed as mean relative proliferation (n = 3; mean ± SEM). (B) 48 h points of wound healing are shown (n = 3; mean ± SEM). (C) MCF‐7 cells were seeded at 30 000 cells per well in a 96‐well plate. Twenty‐four hours later, mitomycin C (10 μg·mL−1) with or without crizotinib (1 μm) was added for 90 min to stop proliferation and inhibit MET. Then a scratch wound was performed with the woundmaker tool and cells were stimulated with HGF at 10 ng·mL−1. Thirty hours points of wound healing are shown. Data are expressed as mean relative proliferation (n = 3; mean ± SEM). Statistical analysis by one‐way ANOVA, *P‐value < 0.0332; **P‐value < 0.0021; ***P‐value < 0.0002; ****P‐value < 0.0001.
Fig. 6
Fig. 6
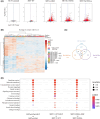
Transcriptional programs induced by the mutated forms of MET. Gene expression was determined by 3′RNA Seq on total RNA extracts of MCF‐7 cells expressing either wild‐type (WT) MET, METex14Del, MET Ile1102Thr or MET His1086Leu, treated or not for 24 h with 30 ng·mL−1 HGF in serum‐free medium (n = 4). (A) Volcano plot representation of differential expression analysis of genes in MCF‐7 cells treated or not with HGF. Red and blue points mark, respectively, the genes with significantly increased or decreased expression (in blue Padj ≤ 0.05, in red FC ≥ 1.5 & Padj ≤ 0.05). (B) Heatmap of relative gene expression significantly upregulated (red) or downregulated (blue) in MCF‐7 cells treated or not with HGF (fold change > 1.5 and P‐value < 0.05; four replicates noted A–D were performed). (C) Venn diagram of genes significantly regulated in response to HGF stimulation in MCF‐7 METex14Del, MET Ile1102Thr and MET His1086Leu cells (fold change ≥ 1.5; ajusted P‐value < 0.05). (D) Dot plot of gene ontology (GO) ‘molecular function’ enrichment among genes showing significant differential expression in MCF‐7 cells according to whether they were stimulated or not with HGF (P value adj < 0.05 and fold change > 1.5).
Fig. 7
Fig. 7
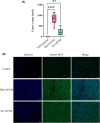
Experimental tumor growth of NIH3T3 cells expressing MET variants. In vivo tumor xenograft experiments were performed with SCID mice. (A) Scatter plots of the tumor volumes (mm3) at the end point in SCID mice xenografted with NIH3T3 parental cells, NIH3T3 cells stably expressing MET Ile1102Thr (8 measured tumors) or MET Met1268Thr (10 measured tumors). Error bars indicate the SEM; one way Anova test with: **P‐value < 0.0021; ****P‐value < 0.0001. (B) MET expression was analyzed by immunofluorescence in tumor slides of cells expressing MET M1268T and MET I1102T and adjacent murine tissue (control). Representative pictures of Hoechst staining, human MET staining and merge are shown. Scale bars represent 20 μm.
Fig. 8
Fig. 8
I1102T and H1086L MET mutations modeling in MET kinase structure. (A) Crystal structure of the ATP‐bound human MET kinase domain (PDB 3DKC) analyzed through pymol. (B) ATP‐binding site and catalytic site motifs are highlighted in the kinase domain. The β1–β3 strands, P‐loop (magenta), and hinge (teal) support the catalytic site, where ATP (orange) binds. Binding is stabilized by backbone interactions with hinge residues (P1176, M1178) and interactions with the conserved D1240 of the DFG motif and catalytic Lys (K1128). I1102 is a residue in the β1 strand of the N‐lobe, at the entrance of the catalytic site. In the β1–β3 strands, H1112 and H1124 display polar interactions. (C) Representative “inactive” (gray, PDB 2G15) and “active” (blue, PDB 3R7O) human MET kinase domain crystal structures superimposed and analyzed through pymol. (D) Zoom‐in view comparing how the αJM‐helix, αC‐helix, and β3‐β5 motifs are siruated in an “inactive” and an “active” conformation: a conserved salt bridge between the β3 K1128 and αC‐helix E1145 is present in an “active” αC‐helix “in” conformation, and lost in an “inactive” αC‐helix “out” conformation. (E) One‐hundred‐and‐eighty‐degree rotation of the αJM‐helix, αC‐helix, and β3–β5 motifs between the “active” and “inactive” conformations. A salt bridge between the αJM‐helix H1086 and αC‐helix D1151 is present in an “inactive” αC‐helix “out” conformation and lost in the “active” αC‐helix “in” conformation. (F, G) Side‐by‐side view of the αJM‐helix‐αC‐helix interface in the “inactive” (gray) and “active” (blue) conformations. The interface between the JM‐helix and the αC‐helix is supported by hydrophobic interactions, with the exception of a polar patch between H1086 and D1151. These take part in a salt bridge in the “inactive” conformation. Hydrophobic interactions between the αJM‐helix and αC‐helix are maintained in the “active” conformation, but the H1086 and D1151 salt bridge is lost, the distance between these residues going from 3.4 Å in the “inactive” conformation to 7.4 Å in the “active” conformation.

Update of

References

    1. Manning G, Whyte DB, Martinez R, Hunter T, Sudarsanam S. The protein kinase complement of the human genome. Science. 2002;298(5600):1912–1934. - PubMed
    1. Robinson DR, Wu YM, Lin SF. The protein tyrosine kinase family of the human genome. Oncogene. 2000;19(49):5548–5557. - PubMed
    1. Hubbard SR. Structural analysis of receptor tyrosine kinases. Prog Biophys Mol Biol. 1999;71(3):343–358. - PubMed
    1. Vogelstein B, Papadopoulos N, Velculescu VE, Zhou S, Diaz LA, Kinzler KW. Cancer genome landscapes. Science. 2013;339(6127):1546–1558. - PMC - PubMed
    1. Bedard PL, Hyman DM, Davids MS, Siu LL. Small molecules, big impact: 20 years of targeted therapy in oncology. Lancet. 2020;395(10229):1078–1088. - PubMed