. 2025 Feb 6:16:1527727.
doi: 10.3389/fmicb.2025.1527727. eCollection 2025.

Fission yeast cells deficient in siderophore biosynthesis require Str2 for ferrichrome-dependent growth

Affiliations

Fission yeast cells deficient in siderophore biosynthesis require Str2 for ferrichrome-dependent growth

Berthy Mbuya et al. Front Microbiol. .

Abstract

Ferrichrome (Fc) acquisition in Schizosaccharomyces pombe is mediated by the cell-surface siderophore-iron transporter Str1. Here, we report that Str2, a protein homologous to Str1, localizes to the vacuolar membrane. Like Str1, Str2 expression is transcriptionally regulated in response to changes in iron concentrations. Both the str2+ and str1+ genes are induced under low-iron conditions and are repressed by the iron-responsive GATA-type transcription factor Fep1 when iron is abundant. Under high-iron conditions, chromatin immunoprecipitation (ChIP) assays reveal that TAP-Fep1 occupies the str2+ and str1+ promoters. Isolated vacuoles from str2Δ fep1Δ cells expressing GFP-tagged Str2 exhibit iron accumulation in vacuoles upon exposure to exogenous holo-Fc. sib1Δ sib2Δ cells deficient in Fc biosynthesis and lacking the str2+ gene (str2Δ) are unable to grow in the presence of exogenous Fc as a sole source of iron. Further analysis identified that conserved amino acids Tyr539 and Tyr553 in the last predicted loop of Str2 are required for supporting Fc-dependent growth of a sib1Δ sib2Δ mutant strain. Collectively, these findings indicate that the vacuolar Str2 protein plays a role in the consumption of Fc as an iron source, while also revealing the involvement of the vacuole in iron release from exogenous Fc after its assimilation.

Keywords: ferrichrome; fission yeast; iron; iron-regulatory GATA-type transcription factor; siderophore transporter.


Conflict of interest statement

The authors declare that the research was conducted in the absence of any commercial or financial relationships that could be construed as a potential conflict of interest.

Figures
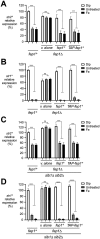
Figure 1
Figure 1
Assessment of the str2+ and str1+ transcript levels in response to iron availability. (A–D) Representative expression profiles of the str2+ and str1+ mRNAs in wild-type (fep1+), fep1Δ, sib1Δ sib2Δ, and fep1Δ sib1Δ sib2Δ strains. The cells were grown in YES medium to an OD600 of 1.0, followed by treatment with either Dip (250 μM) or FeCl3 (Fe, 100 μM) for 90 min, or left untreated. For the fep1Δ or fep1Δ sib1Δ sib2Δ strains, cells were transformed with either an empty integrative plasmid (v. alone) or a plasmid containing an untagged fep1+ or TAP-tagged fep1+ allele. After RNA isolation, the steady-state mRNA levels of str2+ and str1+ were analyzed by RT-qPCR assays. The graphs represent the quantification from three independent RT-qPCR experiments, with error bars indicating standard deviation (± SD; error bars). Statistical significance is represented by asterisks: p < 0.001 (***) and p < 0.0001 (****) (two-way ANOVA with Tukey’s multiple comparisons test, comparing the indicated strains grown under low-iron conditions), whereas “ns” denotes no significant difference. str1+ was analyzed as a control gene, known to be repressed by iron.
Figure 2
Figure 2
Fep1 binds to str2+ and str1+ promoters under iron-replete conditions. (A) Schematic representation of the str2+ and str1+ promoter regions. Arrowheads show primer positions for qPCR analysis. Nucleotide numbers correspond to the positions of primer binding relative to the A of the initiator codon of the str2+ or str1+ gene. Empty ovals depict promoter regions containing GATA elements, which are known to serve as binding sites for Fep1. (B) Logarithmic phase fep1Δ php4Δ cells expressing untagged or TAP-tagged fep1+ alleles were incubated in the presence of Dip (250 μM) or FeCl3 (Fe, 100 μM) for 3 h. Following chromatin preparation and immunoprecipitation using Sepharose-bound anti-mouse IgG antibodies, specific regions of the str2+ and str1+ promoters were analyzed by qPCR to assess TAP-Fep1 occupancy. TAP-Fep1 binding to the str2+ (positions −80 to −49) and str1+ (positions −873 to −809) promoter regions was calculated by measuring the enrichment of specific amplified str2+ and str1+ promoter fragments relative to an 18S ribosomal DNA coding region. ChIP data were calculated as values of the largest amount of chromatin measured (fold enrichment). Results are shown as averages ± SD from three independent experiments, each performed in biological triplicate. Asterisks indicate statistical significance (****p < 0.0001, one-way ANOVA with Dunnett’s multiple comparisons test, comparing iron-replete cells expressing TAP-Fep1).
Figure 3
Figure 3
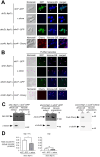
Effect of fep1Δ deletion on Str2 protein expression and localization. (A,B) str2Δ, str2Δ fep1Δ, str2Δ sib1Δ sib2Δ, and str2Δ fep1Δ sib1Δ sib2Δ strains expressing Str2-GFP were grown to an OD600 of 1.0. The cultures were then either left untreated (−) or treated with Dip (250 μM) or FeCl3 (Fe, 100 μM) for 3 h. In the case of str2Δ sib1Δ sib2Δ and str2Δ fep1Δ sib1Δ sib2Δ strains, Dip-treated cells were either left without further supplementation or supplemented with holo-Fc (1 μM) during the final hour of treatment. Whole cell extracts were analyzed by immunoblot assays with anti-GFP and anti-α-tubulin antibodies. The positions of molecular weight markers (in kDa) are indicated on the right side. (C,D) Fluorescence microscopy was performed on cells incubated from each group of cultures described in panels A and B to visualize the localization of Str2-GFP (center left). Cell morphology was examined using Nomarski optics (far left). White arrowheads point to examples of vacuole membranes. FM4-64 staining (center right), a marker of vacuolar membranes, was also visualized by fluorescence microscopy. Merged images of Str2-GFP and FM4-64 are shown in the far-right panels. The microscopy results are representative of three independent experiments, each performed in biological triplicate.
Figure 4
Figure 4
Str2 co-purifies with yeast vacuoles that exhibit iron accumulation. (A) str2Δ fep1Δ cells expressing either an empty plasmid (v. alone) or the str2+-GFP allele were grown in YES medium to an OD600 of 1.0. The cultures were then incubated with Dip (250 μM) for 3 h. In the final hour of this treatment, holo-Fc (1 μM) was added, followed by vacuole isolation from each group of cultures. For the abc3Δ fep1Δ and cox4Δ fep1Δ mutant strains, the abc3+-GFP and cox4+-Cherry alleles were reintroduced, and these cells were cultured under the same conditions as the str2Δ fep1Δ cells expressing GFP-tagged Str2. The above-mentioned cultures were examined by fluorescence microscopy to visualize the cellular localization of Str2-GFP, Abc3-GFP, and Cox4-Cherry (center left), along with the accumulation of fluorescent bimane-GS (center right). Merged images of GFP or Cherry and bimane-GS fluorescent signals are shown in the far-right panels. Cell morphology was examined using Nomarski optics (far left). White arrowheads indicate examples of vacuole membranes. (B) Vacuoles were purified from each group of cultures described in panel A and visualized by fluorescence microscopy to observe Str2-GFP, Abc3-GFP, Cox4-Cherry, and bimane-GS fluorescent signals. Merged images of GFP and bimane-GS fluorescent signals are displayed in the far-right panels. Pink arrowheads point to examples of purified vacuoles. (C) Aliquots of total cell extracts and vacuole preparations from each group of cultures were analyzed by immunoblotting using anti-GFP, anti-Cherry, and anti-α-tubulin antibodies. Abc3-GFP was used as a known vacuolar membrane marker, whereas the absence of the Cox4-Cherry and α-tubulin signals confirmed the specificity of the vacuole preparations. (D) Purified vacuoles from str2Δ fep1Δ cells expressing an empty plasmid (v. alone) or the str2+-GFP allele were analyzed using a BPS-based spectrophotometric method to quantitatively measure iron levels. Cells were incubated with Dip (250 μM) for 3 h. In the final hour of this treatment, holo-Fc (1 μM) was added or omitted. Results are representative of three independent experiments. Data are presented as mean ± SD. Statistical significance is indicated by asterisks, with **p < 0.01 (determined by one-way ANOVA with Dunnett’s multiple comparisons test, comparing against cells expressing Str2-GFP).
Figure 5
Figure 5
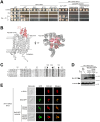
sib1Δ sib2Δ mutant cells require Str2 for Fc-dependent growth. (A) Wild-type (WT), sib1Δ sib2Δ, sib1Δ sib2Δ str2Δ, sib1Δ sib2Δ str1Δ, and sib1Δ sib2Δ str1Δ str2Δ cells, as well as sib1Δ sib2Δ str2Δ cells expressing str2+-GFP, str2-Y539A/Y553A-GFP or str2-Y539A/R546A/Y553A-GFP alleles were grown in YES medium to an OD600 of 1.0, and then spotted in serial dilutions (6,000 cells/10 μL; 600 cells/10 μL; and, 60 cells/10 μL) onto medium without Dip or Fc supplementation (control) or supplemented with Dip (140 μM) or a combination of Dip and Fc (0.1 or 1 μM). (B) A predicted three-dimensional structure of Str2 is shown, with potential transmembrane-spanning domains indicated in gray and the STID highlighted in red. (C) Amino acid alignment of the predicted carboxyl-terminal final loop of S. pombe Str2 with other predicted final loops found in S. pombe Str1, A. fumigatus MirB, A. nidulans MirC, C. glabrata Sit1, and S. cerevisiae Arn1 and Arn3. Arrows indicate three highly conserved Tyr (Y) and Arg (R) residues. Amino acid sequence numbers refer to their position relative to the first amino acid of each protein. (D) Whole extracts from aliquots of iron-starved sib1Δ sib2Δ str2Δ cells expressing an empty plasmid (v. alone), str2+-GFP, str2-Y539A/Y553A-GFP or str2-Y539A/R546A/Y553A-GFP alleles were analyzed by immunoblotting using anti-GFP and anti-α-tubulin antibodies. The positions of molecular weight markers (in kDa) are indicated on the right side. (E) sib1Δ sib2Δ str2Δ cells expressing an empty plasmid (v. alone), str2+-GFP, str2-Y539A/Y553A-GFP or str2-Y539A/R546A/Y553A-GFP alleles treated with Dip were analyzed by fluorescence microscopy to detect GFP fluorescence (center left), along with FM4-64 staining (center right). Merged images of GFP and FM4-64 signals are shown in the far-right panels. Cell morphology was examined using Nomarski optics (far left). White arrowheads indicate examples of vacuole membranes.
Figure 6
Figure 6
The Tyr539, Arg546, and Tyr553 residues of Str2 play an important role for maximal iron accumulation in vacuoles. str2Δ fep1Δ cells expressing str2+-GFP, str2-Y539A/Y553A-GFP or str2-Y539A/R546A/Y553A-GFP alleles were grown in YES medium to an OD600 of 1.0. The cultures were then incubated with Dip (250 μM) for 3 h. In the final hour of this treatment, holo-Fc (1 μM) was added, followed by vacuole isolation from each group of cultures. Purified vacuoles from each culture were analyzed using a BPS-based spectrophotometric method to quantitatively measure iron levels. Results are representative of three independent experiments. Data are presented as mean ± SD. Statistical significance is indicated by asterisks, with **p < 0.01 (determined by one-way ANOVA with Dunnett’s multiple comparisons test, comparing against cells expressing Str2-GFP).

References

    1. Adam M., Robert F., Larochelle M., Gaudreau L. (2001). H2A.Z is required for global chromatin integrity and for recruitment of RNA polymerase II under specific conditions. Mol. Cell. Biol. 21, 6270–6279. doi: 10.1128/MCB.21.18.6270-6279.2001 - DOI - PMC - PubMed
    1. Aguiar M., Orasch T., Misslinger M., Dietl A. M., Gsaller F., Haas H. (2021). The siderophore transporters Sit1 and Sit2 are essential for utilization of ferrichrome-, ferrioxamine-and coprogen-type siderophores in Aspergillus fumigatus. J. Fungi 7:768. doi: 10.3390/jof7090768 - DOI - PMC - PubMed
    1. Bellemare D. R., Shaner L., Morano K. A., Beaudoin J., Langlois R., Labbé S. (2002). Ctr6, a vacuolar membrane copper transporter in Schizosaccharomyces pombe. J. Biol. Chem. 277, 46676–46686. doi: 10.1074/jbc.M206444200 - DOI - PubMed
    1. Brault A., Mbuya B., Labbé S. (2022). Sib1, Sib2, and Sib3 proteins are required for ferrichrome-mediated cross-feeding interaction between Schizosaccharomyces pombe and Saccharomyces cerevisiae. Front. Microbiol. 13:962853. doi: 10.3389/fmicb.2022.962853 - DOI - PMC - PubMed
    1. Brault A., Mourer T., Labbé S. (2015). Molecular basis of the regulation of iron homeostasis in fission and filamentous yeasts. IUBMB Life 67, 801–815. doi: 10.1002/iub.1441 - DOI - PubMed

LinkOut - more resources