. 2025 Jan 31:28:481-497.
doi: 10.1016/j.reth.2025.01.016. eCollection 2025 Mar.

Cell culture expansion media choice affects secretory, protective and immuno-modulatory features of adipose mesenchymal stromal cell-derived secretomes for orthopaedic applications

Affiliations

Cell culture expansion media choice affects secretory, protective and immuno-modulatory features of adipose mesenchymal stromal cell-derived secretomes for orthopaedic applications

Enrico Ragni et al. Regen Ther. .

Abstract

Introduction: Mesenchymal stromal cells (MSCs) gained attention for their anti-inflammatory and trophic properties, with musculoskeletal diseases and osteoarthritis (OA) being among the most studied conditions. Alongside cells, their released factors and extracellular vesicles (EVs), overall termed "secretome", are actively sifted being envisioned as the main therapeutic actors. In addition to standard supplementation given by foetal bovine serum (FBS) or human platelet lysate (hPL), new good manufacturing practice (GMP)-compliant serum/xeno (S/X)-free media formulations have been proposed, although their influence on MSCs phenotype and potential is scarcely described. The aim of this study is therefore to evaluate, in the OA context, the differences in secretome composition and potential after adipose-MSCs (ASCs) cultivation in both standard (FBS and hPL) and two next generation (S/X) GMP-ready supplements.

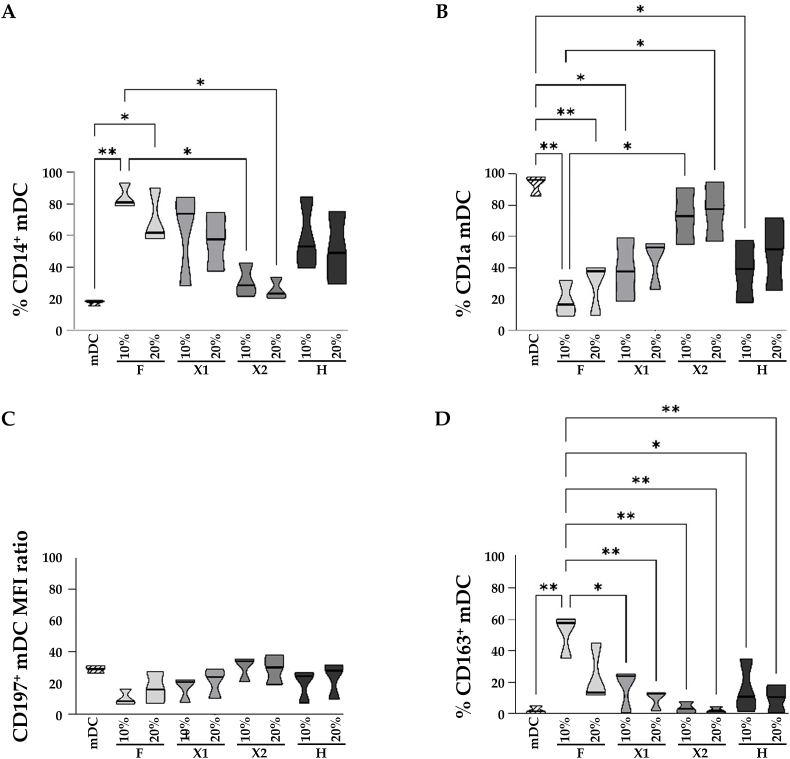
Methods: Immunophenotype and secretory ability at soluble protein and EV-related levels, including embedded miRNAs, were analysed in the secretomes by means of flow cytometry, nanoparticle tracking analysis, high throughput ELISA and qRT-PCR arrays. Secretomes effect was tested in in vitro models of chondrocytes, lymphocytes and monocytes to mimic the OA microenvironment.

Results: Within a conserved molecular signature, a divergent fingerprint emerged for ASCs' secretomes collected after expansion in standard FBS/hPL or next-generation S/X formulations. Regarding soluble factors, a less protective feature for those in the secretome collected after ASCs were cultured in S/X media emerged. Moreover, the overall message for EV-miRNAs was characterized by a preponderance of protective signals in FBS and hPL conditions in a context of general safeguard given by ASCs released molecules. This dichotomy was reflected on secretomes' potential in vitro, with expansion in hPL resulting in the most effective secretome for chondrocytes and in FBS for immune cells.

Conclusions: These data open the question about the implications from using new media for MSCs expansion for clinical application. Although the undeniable advantages for GMP compliant processes, this study results suggest that new media formulations would deserve a deep characterization to drive the choice of the most effective one tailored to each specific application.

Keywords: Cartilage; Immune cells; Mesenchymal stromal cells; Osteoarthritis; Regenerative medicine; Secretome.


Conflict of interest statement

The authors declare that they have no known competing financial interests or personal relationships that could have appeared to influence the work reported in this paper. All authors guarantee the originality of the study and ensure that it has not been published previously. All the listed authors have read and approved the submitted manuscript.

Figures

Fig. 1
Fig. 1
ASCs immunophenotype. A) Cytograms of markers tested in a representative ASCs cultivated in the four conditions of the study. Unstained sample represents ASCs cultivated in FBS (condition F). B) Percentage of positive ASCs for both MSCs (CD73/90/105/146) and hemato-endothelial (CD31/45) markers (mean ± SD, N = 3 independent experiments). C) Significant differences for CD105 and CD146 between ASCs in the four media. (median (thick line) and 25th and 75th quartiles; ∗p ≤ 0.05, ∗∗≤ 0.01, ∗∗∗p ≤ 0.001, ∗∗∗∗p ≤ 0.0001; N ≥ 3 independent experiments).
Fig. 2
Fig. 2
Functional association network for identified secreted factors. A) Protein–protein interaction levels for 42 proteins shared in ASCs secretome, regardless culture medium, mined using STRING. Blue connections = proteins with known interactions based on curated databases; violet connections = proteins with experimentally determined interactions. Colourless nodes = proteins not related to the terms: MSK system disease, ECM organization, regulation of ECM organization, immune or inflammatory response. False discovery rate (FDR) for each term is also shown. Empty nodes = proteins of unknown 3D structure; filled nodes = known or predicted 3D structure. B) Protein–protein interaction networks for proteins belonging to regulation of T cell proliferation, activation and of macrophage differentiation, chemotaxis.
Fig. 3
Fig. 3
ASC-EVs characterization. A) EVs released per cell calculated from NTA data. (median (thick line) and 25th and 75th quartiles, §p ≤ 0.10, ∗≤ 0.05, ∗∗≤ 0.01; N ≥ 3 independent experiments). B) EVs size analysis between conditions using NTA (each curve was obtained merging the data from three independent ASC lines). Mode size results are displayed as violin plots showing median (thick line) and 25th and 75th quartiles ∗ for p ≤ 0.05, ∗∗ ≤ 0.01; N ≥ 3 independent experiments). C) Representative cytograms of EVs (CD9/63/81) and MSCs (CD73/90) markers tested in a representative ASC-EVs and superimposed in the dot plot with FITC-positive calibration beads of predetermined size (100, 160, 200, 240, 300, 500 and 900 nm) to confirm reliability of particle detection in the nanometric range. Unstained and CFSE stained samples represents only EVs from ASCs cultivated in FBS (condition F). D) Percentage of positive EVs for each marker (mean ± SD, N = 3 independent experiments).
Fig. 4
Fig. 4
Comparison of EV-miRNAs expression profiles in the first quartile of ASCs after expansion in the different media. (A) Principal component analysis of the ln transformed miRNA values expressed as pg per exp9 EVs (mean of the three ASC-EVs samples for each condition). X and Y axis show principal component 1 and principal component 2 that explain 82.6 % and 14.7 % of the total variance. (B) Heat map of hierarchical clustering analysis of ln transformed miRNA values expressed as pg per exp9 EVs (mean of the three ASC-EVs samples for each condition) with sample clustering tree at the top. Red shades = high expression levels; blue shades = low expression levels.
Fig. 5
Fig. 5
Effect of secretomes on inflamed chondrocytes. A) Proliferation of chondrocytes exposed to IL1β with or without different dilutions of secretomes. (∗p-value ≤0.05, ∗∗≤ 0.01; N = 3. B) Gene expression modulation (fold change vs CTRL set as 1) for chondrocytes exposed to IL1β without and with secretomes at 1:1 dilution. C) Single gene modulation (∗p-value ≤0.05, ∗∗≤ 0.01, ∗∗∗≤ 0.001 and ∗∗∗∗≤ 0.0001; N = 3).
Fig. 6
Fig. 6
Immunomodulatory effects of secretomes on PBMC proliferation and T lymphocytes differentiation. A) PBMCs proliferation (∗p-value ≤0.05, ∗∗ ≤ 0.01 vs control (PBMC + anti-CD3), N = 3 independent experiments performed using 3 different PBMC donors and 3 different ASC secretome preparations). B) Treg induction. C) Th subsets differentiation.
Fig. 7
Fig. 7
Immunomodulatory effects of secretomes on monocyte differentiation toward antigen-presenting cells. The expressions of CD14 (A), CD1a (B) and CD197 (B) was assessed by flow cytometry to evaluate mDC differentiation. Furthermore, the expression of the macrophage type 2 marker, CD163 is presented (D). Results are presented as a percentage of expression or mean fluorescence intensity. mDC = mature Dentritic Cells; MFI = mean fluorescence intensity (calculated as the ratio between MFI of control and MFI of treated samples). ∗p-value ≤0.05, ∗∗ ≤0.01; N = 3 independent experiments performed using 3 different PBMC donors and 3 different ASC secretome preparations.

References

    1. Mavrogenis A.F., Karampikas V., Zikopoulos A., Sioutis S., Mastrokalos D., Koulalis D., et al. Orthobiologics: a review. Int Orthop. 2023 doi: 10.1007/s00264-023-05803-z. - DOI - PubMed
    1. Hunter D.J., Bierma-Zeinstra S. Osteoarthritis Lancet. 2019 doi: 10.1016/S0140-6736(19)30417-9. - DOI - PubMed
    1. Huebner K., Frank R.M., Getgood A. Ortho-biologics for osteoarthritis. Clin Sports Med. 2019 doi: 10.1016/j.csm.2018.09.002. - DOI - PubMed
    1. Hohmann E., Tetsworth K., Glatt V. Is platelet-rich plasma effective for the treatment of knee osteoarthritis? A systematic review and meta-analysis of level 1 and 2 randomized controlled trials. Eur J Orthop Surg Traumatol. 2020 doi: 10.1007/s00590-020-02623-4. - DOI - PubMed
    1. Kim K.I., Kim M.S., Kim J.H. Intra-articular injection of autologous adipose-derived stem cells or stromal vascular fractions: are they effective for patients with knee osteoarthritis? A systematic review with meta-analysis of randomized controlled trials. Am J Sports Med. 2023 doi: 10.1177/03635465211053893. - DOI - PubMed

LinkOut - more resources