. 2025 Jan 15;7(3):100965.
doi: 10.1016/j.xkme.2025.100965. eCollection 2025 Mar.

Spot Versus 24-Hour Urine Osmolality Measurement in Autosomal Dominant Polycystic Kidney Disease: A Diagnostic Test Study

Affiliations

Spot Versus 24-Hour Urine Osmolality Measurement in Autosomal Dominant Polycystic Kidney Disease: A Diagnostic Test Study

Ayub Akbari et al. Kidney Med. .

Abstract

Rationale & objective: Arginine vasopressin (AVP) is an established driver of cyst growth in autosomal dominant polycystic kidney disease (ADPKD). Urine osmolality (osm) measures are surrogate markers of AVP activity. Both 24-hour and spot urine samples are used as indicators of AVP suppression. The agreement between these 2 measurements remains unclear.

Study design: A retrospective cohort study.

Setting & study population: Three hundred and forty-nine patients with ADPKD with 839 urine samples from a tertiary care center.

Selection criteria for study: Patients with ADPKD with records of spot and 24-hour urine measurements.

Data extraction: Consecutive patients' data from January 2018 to March 2023 were extracted from the quality assurance database of The Ottawa Hospital Cystic Kidney Disease Clinic.

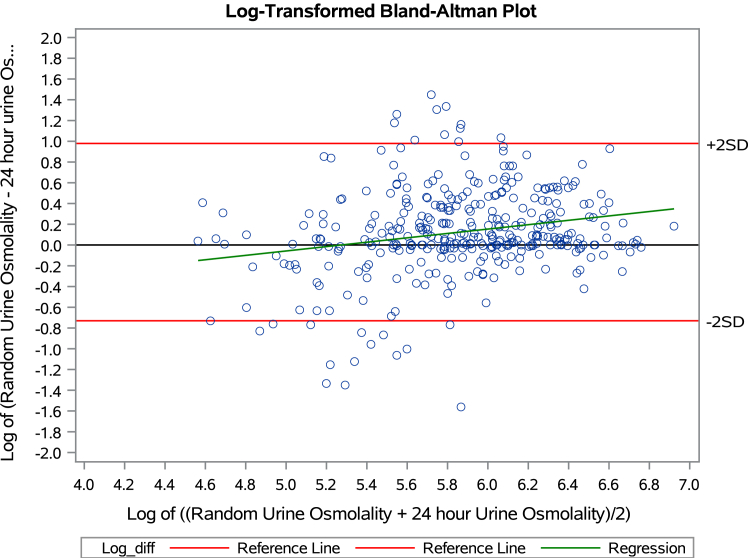
Analytical approach: Discordance assessed at target urine osmolality of 250 and 270 mmol/kg. Agreement assessed by Bland-Altman plots. The percentage of patients with difference in osmolality between the 2 measures for cutoff points of > 50, > 100, >150, and > 200 mmol/kg was calculated.

Results: The mean 24-hour urine osm was 364 mmol/kg, and the mean spot urine osm was 424 mosm/kg. Mean age of 46 years, 52% females, and 47 (13.5%) were on tolvaptan. Overall, in comparing spot urine osm to 24-hour urine osm, the discordance at 250 and 270 mmol/kg was 24% with poor agreement on Bland-Altman plots. The differences between the 2 measures at varying cutoff points were 53.9% at 50 mmol/kg, 35.8% at 100 mmol/kg, 24.1% at 150 mmol/kg, and 16.1% at 200 mmol/kg. Results were similar when only a single measurement from each patient was used for analysis.

Limitations: Total of 29% of patients did not have concurrent spot urine osmolality and 24-hour urine osmolality. The study was conducted at a single center. Limited number of patients were on tolvaptan.

Conclusions: In adults with ADPKD, important differences exist between the 24-hour urine osmolality and spot urine osmolality that preclude interchangeable use. The method employed may impact clinical decision-making. More research is needed to determine, which urine osm should be used when assessing AVP suppression.

Keywords: Urine osmolarity; autosomal dominant polycystic kidney disease; spot and 24-hour measurement.

Plain language summary

Urine osmolality measures are used clinically to dose tolvaptan in patients with adult polycystic kidney disease. We compared urine osmolality from 24-hour and spot urine samples. We found out that important differences exist between 24-hour and spot urine samples’ osmolality. The method employed to determine urine osmolality may impact clinical decision-making in the management of patients with adult polycystic kidney disease.


Figures

Figure 1
Figure 1
Concordance versus discordance for urine osmolality at 250 and 270 mosm/kg for all samples. This bar chart compares the percentage of concordance and discordance in urine osmolality at thresholds of 250 and 270 mosm/kg across different categories. The green bars represent concordant samples, whereas the red bars indicate discordant samples. The percentages are displayed above each bar.
Figure 2
Figure 2
Concordance versus discordance for urine osmolality at 250 and 270 mosm/kg for Induvial Patients. This bar chart compares the percentage of concordance and discordance in urine osmolality at thresholds of 250 and 270 mosm/kg across different categories. The green bars represent concordant samples, whereas the red bars indicate discordant samples. The percentages are displayed above each bar.
Figure 3
Figure 3
Bland-Altman plot comparing random and 24-hour urine osmolality for all samples. The plot shows the differences between random and 24-hour urine osmolality versus their mean. Open circles represent individual specimen. The black line at zero indicates perfect agreement, whereas the red lines show the limits of agreement (±2 SD from the mean difference). The green regression line indicates any potential bias between the 2 measurements.
Figure 4
Figure 4
Log-transformed. Bland-Altman plot comparing random and 24-hour urine osmolality for all samples. The plot shows the log-transformed differences between random and 24-hour urine osmolality versus their log-transformed mean. Open circles represent individual specimen. The black line at zero indicates perfect agreement, whereas the red lines show the limits of agreement (±2 SD from the mean difference). The green regression line indicates any potential bias between the 2 measurements.
Figure 5
Figure 5
Bland-Altman plot comparing random and 24-hour urine osmolality for individual patients. The plot shows the differences between random and 24-hour urine osmolality versus their mean. Open circles represent individual specimen. The black line at zero indicates perfect agreement, whereas the red lines show the limits of agreement (±2 SD from the mean difference). The green regression line indicates any potential bias between the 2 measurements.
Figure 6
Figure 6
Log-transformed Bland-Altman plot comparing random and 24-hour urine osmolality for induvial patients. The plot shows the log-transformed differences between random and 24-hour urine osmolality versus their log-transformed mean. Open circles represent individual specimen. The black line at zero indicates perfect agreement, whereas the red lines show the limits of agreement (±2 SD from the mean difference). The green regression line indicates any potential bias between the 2 measurements.

References

    1. Torres V.E., Harris P.C., Pirson Y. Autosomal dominant polycystic kidney disease. Lancet. 2007;369(9569):1287–1301. doi: 10.1016/S0140-6736(07)60601-1. - DOI - PubMed
    1. Grantham J.J., Mulamalla S., Swenson-Fields K.I. Why kidneys fail in autosomal dominant polycystic kidney disease. Nat Rev Nephrol. 2011;7(10):556–566. doi: 10.1038/nrneph.2011.109. - DOI - PubMed
    1. Devuyst O., Torres V.E. Osmoregulation, vasopressin, and cAMP signaling in autosomal dominant polycystic kidney disease. Curr Opin Nephrol Hypertens. 2013;22(4):459–470. doi: 10.1097/MNH.0b013e3283621510. - DOI - PubMed
    1. Rinschen M.M., Schermer B., Benzing T. Vasopressin-2 receptor signaling and autosomal dominant polycystic kidney disease: from bench to bedside and back again. J Am Soc Nephrol. 2014;25(6):1140–1147. doi: 10.1681/ASN.2013101037. - DOI - PMC - PubMed
    1. Kanbay M., Yilmaz S., Dincer N., et al. Antidiuretic hormone and serum osmolarity physiology and related outcomes: what is old, what is new, and what is unknown? J Clin Endocrinol Metab. 2019;104(11):5406–5420. doi: 10.1210/jc.2019-01049. - DOI - PubMed

LinkOut - more resources