. 2025 Feb 6:16:1516772.
doi: 10.3389/fimmu.2025.1516772. eCollection 2025.

Pre-transplant T-cell clonal analysis identifies CD8+ donor reactive clones that contribute to kidney transplant rejection

Affiliations

Pre-transplant T-cell clonal analysis identifies CD8+ donor reactive clones that contribute to kidney transplant rejection

Jes M Sanders et al. Front Immunol. .

Abstract

Introduction: Responses to allogeneic human leukocyte antigen (HLA) molecules limit the survival of transplanted organs. The changes in T-cell alloreactivity that contribute to this process, however, are not fully understood. We defined a set of donor reactive T-cell clones (DRTC) with the goal to elucidate signatures of kidney allograft rejection.

Methods: DRTC were identified pretransplant using an anti-donor mixed lymphocyte reaction assay: CFSE-diluting CD4+ and CD8+ DRTC were flow-sorted, and the TCR sequences were identified using Adaptive Immunosequencing. DRTC were then tracked in post-transplant biopsies, blood, and urine samples in a cohort of kidney transplant recipients.

Results: In patients with an abnormal biopsy, the majority of CD8+ DRTC found within the allograft were detected in the circulating pre-transplant repertoire. Circulating CD8+ DRTC were more abundant pre- and post-transplant in patients that received non-lymphodepletional induction and developed an abnormal biopsy when compared to stable patients. Additionally, DRTC were detected as early as two weeks post-transplant in the urine of some patients, with some of these clones subsequently identified in follow-up kidney biopsy samples.

Discussion: The findings of our study add to our understanding of T-cell alloreactivity following kidney transplantation and provide evidence for the role of pre-defined alloreactive T-cells in the development of allograft rejection.

Keywords: T-cell mediated rejection; T-cell receptor sequencing; alloreactivity; kidney transplant rejection; mechanisms of rejection.


Conflict of interest statement

BB and ES are both salaried employees and own stock options of Adaptive Biotechnologies. The remaining authors declare that the research was conducted in the absence of any commercial or financial relationships that could be construed as a potential conflict of interest.

Figures

Figure 1
Figure 1
Generation, sorting, and sequencing of DRTC. (A) CSFE-labeled recipient PBMCs were cultured in bulk with irradiated (3000rad) PKH26-labeled donor PBMCs. (B) Cells were harvested, labeled with anti-CD3, anti-CD4, and anti-CD8 monoclonal antibodies and sorted for CD4+ and CD8+ subsets after gating on the CSFE-diluted cell population. (C) Adaptive immunosequencing was used to amplify and simultaneously sequence rearranged TCRβ sequences in a multiplex PCR.
Figure 2
Figure 2
Defining DRTC Using Differential Abundance. DRTC were defined by comparing clone frequencies in the MLR sorted (A) CD4+ and (B) CD8+ samples against the unstimulated, pre-transplant sample. A representative experiment to define DRTC is depicted. TCRβ sequences detected in the MLR CD4+ or CD8+ sorted populations are plotted (Y-axis) against TCRβ sequences identified in the unstimulated pre-transplant PBMC sample (X-axis). DRTC were defined based upon criteria described in Materials and Methods. Blue circles denote DRTC. Grey circles are clones that did not meet established criteria. Orange circles are clones that are significantly more abundant in the unstimulated, pre-transplant PBMC but are likely not alloreactive as they were less frequent in the MLR sorted population compared to the unstimulated, pre-transplant PBMC sample. (C) Scatterplot comparing the number of CD4+ and CD8+ DRTC generated in the pre-transplant MLR in a paired fashion (N=54; Wilcoxon Signed Rank Test).
Figure 3
Figure 3
Dynamics of the circulating alloreactive repertoire from pre-transplant to 3 months post-transplant. The absolute number of DRTC, the proportion of all clonotypes (i.e., breadth), and proportion of all T-cells (i.e., frequency/depth) was evaluated in the pre-transplant (Pre-Tx) and ~3-month posttransplant (Post-Tx) PBMC samples to assess the impact of induction therapy on DRTC. Left Panel) Scatterplots comparing (A, B) the absolute number, (C, D) the proportion of all clonotypes, and the (E, F) the frequency of CD4+ and CD8+ DRTC in subjects that received Campath (Campath Pre-Tx N=34, Post-Tx N=30; Wilcoxon Signed Rank Test). Right Panel) Scatterplots comparing (A, B) the absolute number, (C, D) the proportion of all clonotypes, and the (E, F) the frequency of CD4+ and CD8+ DRTC in subjects that did not receive Campath (Non-Campath Pre-Tx N=20, Post-Tx N=18; Wilcoxon Signed Rank Test).
Figure 4
Figure 4
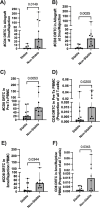
Allograft and circulating DRTC metrics associated with development of an abnormal biopsy in subjects that received non-lymphodepletional induction. DRTC were detected in pre-transplant PBMC, post-transplant allografts, and biopsy-paired post-transplant PBMC samples in order to identify T-cell changes in subjects that developed rejection/borderline rejection. (A, B) Scatterplots comparing the number of graft-infiltrating CD4+ and CD8+ DRTC in subjects that developed an abnormal biopsy versus those that had a normal biopsy at 3 months post-transplant (Stable N=7, Non-Stable N=9; Mann Whitney U test). Scatterplots comparing the (C) absolute number and (D) frequency of CD8+ DRTC in the unstimulated, pre-transplant PBMC between subjects that would subsequently develop an abnormal biopsy and those that remained stable at 3-months post-transplant (Stable N=11, Non-Stable N=9; Mann Whitney U test). (E, F) Scatterplots comparing the number and absolute frequency of CD8+ DRTC in the biopsy-paired, post-transplant PBMC sample (Stable N=10, Non-Stable N=8; Mann Whitney U test).
Figure 5
Figure 5
Evaluating the relationship of DRTC found within the allograft to those in the circulation in subjects that received non-lymphodepletional induction and developed an abnormal biopsy. In order to determine if DRTC found within the allograft could be also detected in the circulation (i.e., PBMC sample), the proportion of allograft clones that were identified i) in the pre-transplant (Pre-Tx) PBMC ii) in both Pre-Tx and paired, post-transplant (Post-Tx) PBMC, iii) newly in the Post-Tx period and iv) only in the kidney and never in the periphery was evaluated. Scatterplots assessing this proportion for (A) CD4+ and (B) CD8+ DRTC are shown (N=9). A proportion of 1.0 would suggest all DRTC found in the allograft at rejection were also detected at a particular time point. The majority of DRTC were found in either the Pre- or Post-Tx PBMC samples. However, there was a significant decrease in the proportion of CD4+ and CD8+ allograft DRTC that were present in the Pre-Tx PBMC AND were also found in the Post-Tx sample (Pre-Tx N=9, Post-Tx N=8; Wilcoxon Signed Rank Test).
Figure 6
Figure 6
Assessment of DRTC in 2-week urine samples and tracking of these clones in post-transplant allograft biopsies. DRTC were detected in 2-week urine samples to determine if early infiltration of allografts by DRTC was associated with subsequent development of rejection/borderline rejection. (A, B) Scatterplots comparing the number of CD4+ and CD8+ DRTC detected in 2-week urine samples in subjects that received non-lymphodepletional induction therapy (Stable N=9, Non-Stable N=5; Mann-Whitney U Test). Subject 62R was removed from this analysis given rejection occurred at 2 weeks post-transplant. The presence of those same 2-week urine DRTC was then assessed in post-transplant allograft biopsies obtained at 3-months post-transplant or at rejection. (C, D) Scatterplots showing the number of CD4+ and CD8+ DRTC detected in 2-week urine samples that were also identified in follow-up kidney transplant biopsies. Overlapping CD8+ TCR sequences found in both the 2-week urine sample and follow-up kidney biopsy in subjects with acute rejection are shown in Supplementary Tables S3 - 5 .

References

    1. Mederacke YS, Nienen M, Jarek M, Geffers R, Hupa-Breier K, Babel N, et al. . T cell receptor repertoires within liver allografts are different to those in the peripheral blood. J Hepatol. (2021) 74:1167–75. doi: 10.1016/j.jhep.2020.12.014 - DOI - PubMed
    1. Lodhi SA, Lamb KE, Meier-Kriesche HU. Solid organ allograft survival improvement in the United States: the long-term does not mirror the dramatic short-term success. Am J Transplant. (2011) 11:1226–35. doi: 10.1111/j.1600-6143.2011.03539.x - DOI - PubMed
    1. Tanriover B, Jaikaransingh V, MacConmara MP, Parekh JR, Levea SL, Ariyamuthu VK, et al. . Acute rejection rates and graft outcomes according to induction regimen among recipients of kidneys from deceased donors treated with tacrolimus and mycophenolate. Clin J Am Soc Nephrol. (2016) 11:1650–61. doi: 10.2215/CJN.13171215 - DOI - PMC - PubMed
    1. Tamargo CL, Kant S. Pathophysiology of rejection in kidney transplantation. J Clin Med. (2023) 12:4130. doi: 10.3390/jcm12124130 - DOI - PMC - PubMed
    1. Hart A, Smith J, Skeans M, Gustafson S, Wilk A, Robinson A, et al. . OPTN/SRTR 2016 annual data report: kidney. Am J Transplant. (2018) 18:18–113. doi: 10.1111/ajt.14557 - DOI - PMC - PubMed