. 2025 Feb 4:15:1500696.
doi: 10.3389/fimmu.2024.1500696. eCollection 2024.

Staphylococcus aureus-specific TIGIT+ Treg are present in the blood of healthy subjects - a hurdle for vaccination?

Affiliations

Staphylococcus aureus-specific TIGIT+ Treg are present in the blood of healthy subjects - a hurdle for vaccination?

Jonah Clegg et al. Front Immunol. .

Abstract

Staphylococcus aureus poses an enormous burden of morbidity and mortality worldwide. Making an efficacious vaccine has however proven extremely challenging. Due to colonizing interactions, pre-existing S. aureus-specific CD4+ T cells are often found in the human population and yet a detailed characterization of their phenotypes and how they might in turn impact vaccine efficacy are thus far unknown. Using an activation induced marker assay to sort for S. aureus-specific CD4+ T cells in an effector function-independent manner, single cell transcriptomic analysis was conducted. Remarkably, S. aureus-specific CD4+ T cells consisted not only of a broader spectrum of conventional T cells (Tcon) than previously described but also of regulatory T cells (Treg). As compared to polyclonally-activated CD4+ T cells, S. aureus-specific Tcon were enriched for the expression of the Th17-type cytokine genes IL17A, IL22 and IL26, while higher percentages of S. aureus-specific Treg expressed the T Cell Immunoreceptor with Ig and ITIM domains (TIGIT), a pleiotropic immune checkpoint. Notably, the antagonistic anti-TIGIT mAb Tiragolumab increased IL-1β production in response to S. aureus in vitro. Therefore, these results uncover the presence of S. aureus-specific TIGIT+ Treg in the blood of healthy subjects that could blunt responses to vaccination and indicate TIGIT as a potential targetable biomarker to overcome pre-exposure-induced immunosuppression.

Keywords: Staphylococcus aureus; TIGIT; Th17; Treg; colonization; host-pathogen interactions; vaccines.


Conflict of interest statement

GC, ST, CS, BC, ESi, MBa, MBr, FB, and ESo are employees of the GSK group of companies. JC, MM and MS were PhD student at GSK at the time of the study. AC and GC were part of the Scientific Leadership Program at GSK Vaccines at the time of the study. FB is listed as inventor on patents of S. aureus vaccine candidates owned by GSK. BC, ESi, MBa, MBr, FB, and ESo and report ownership of GSK shares and/or restricted GSK shares. The remaining author declares that the research was conducted in the absence of any commercial or financial relationships that could be construed as a potential conflict of interest. The author(s) declared that they were an editorial board member of Frontiers, at the time of submission. This had no impact on the peer review process and the final decision.

Figures

Figure 1
Figure 1
AIM assay identified CD4+ T cells specific for S. aureus that are enriched for the skin-homing marker CLA in the blood of healthy subjects. PBMCs from healthy donors were enriched via negative selection into CD4+ T cells (CD4+) and CD4+ T cell-depleted (CD4-) fractions. CD4- fraction was irradiated and mixed at a 1:1 ratio with the CD4+ fraction. Cells were then stimulated for 24 h with HK S. aureus, or α-CD3/CD28 as positive control, or left untreated (Medium) as negative control. (A) Flow-cytometric plots showing co-expression of OX40 and CD137 (AIM+) on CD4+ T cells from one representative donor after stimulation with HK S. aureus (S. aureus-specific) or α-CD3/CD28 antibodies (polyclonally-activated). See Supplementary Figure 1 for gating strategy. (B) Percentages of AIM+ CD4+ T cells for 16 healthy donors analyzed. Each circle represents a donor, colored circles represent the 6 donors that were further analyzed for CLA expression in D and by SORT-seq. Mean values ± 95% CI for each culture condition are also shown. Dotted line represents the arbitrary cut-off (0.16% AIM+ CD4+ T cells, set doubling the highest percentage of AIM+ CD4+ T cells observed without stimulation) used to identify responders to S. aureus (12 donors out of 16). (C) Flow-cytometric plots showing CLA expression on S. aureus-specific and polyclonally-activated CD4+ T cells from one representative donor. (D) Donor-matched percentages of S. aureus-specific or polyclonally-activated CLA+CD4+ T cells from 6 donors (indicated by colored circles in B). Statistical analysis was performed using a paired t-test. P ≤ **0.01.
Figure 2
Figure 2
SORT-Seq analysis of S. aureus-specific and polyclonally-activated CD4+ T cells revealed 3 cell clusters: Activated T cells (Tact), Trm-like cells and Treg. PBMCs isolated from 6 healthy donors (coloured circles in Figures 1B, D ) were separated via negative selection into CD4+ and CD4- fractions. After irradiation of CD4- cells, both fractions were re-mixed at a 1:1 ratio and stimulated with HK S. aureus or polyclonally with α-CD3/CD28. CD4+ T cells co-expressing OX40 and CD137 (AIM+) after 24 h stimulation were sorted via flow-cytometry and analyzed by SORT-seq. (A) UMAP representation of scRNA-seq merged data of S. aureus-specific and polyclonally-activated CD4+ T cells from 6 donors (4,690 cells in total). Merged datasets were divided into 3 clusters via Leiden clustering and annotated using different colors. (B) Heatmap of unsupervised clustering analysis showing the fold upregulation of the top 20 genes used to differentiate each of the 3 clusters shown in (A, C) Trajectory analysis starting from CCR7-expressing CD4+ T cells (black dot in the center of the UMAP). Heatmap showing that cells along the trajectory displayed signature differences increasingly associated with different cell function of Tact, Trm-like and Treg cells. (D) Gene set enrichment analysis (GSEA) reporting the Normalized Enrichment Score (NES) for each of the 3 clusters using the top 50 cluster-defining genes compared against gene lists obtained from published literature. Circle size indicates proportion of genes present in a specific gene set whereas the color scale refers to P value. (E) Proportional representations in each of the 3 clusters for each of the 6 donors analyzed per stimulation condition. No significative difference by two-tailed t-test among S. aureus-specific and polyclonally-activated CD4+ T cells.
Figure 3
Figure 3
The cytokine signature of S. aureus-specific CD4+ T cells from healthy donors consists of IL17A, IL22, and IL26. (A-C) PBMCs isolated from 6 healthy donors were sorted via negative selection into CD4+ and CD4- fractions. CD4- cells were irradiated and both fractions were re-mixed at a ratio of 1:1 and stimulated for 24 h with HK S. aureus or α-CD3/CD28. AIM+ CD4+ T cells were then FACS-sorted and scRNA-seq analysis performed. (A) UMAPs showing the distinct cell localizations for each stimulation condition: S. aureus-specific and polyclonally-activated CD4+ T cells in red and blue, respectively. The distribution and co-localization of cytokine transcription was assessed by mapping areas of expression (represented by colored contours) for the reported cytokine-encoding genes. (B) Heatmap representing the percentages of S. aureus-specific and polyclonally-activated CD4+ T cells transcribing a panel of 14 cytokines calculated for each donor. Cytokines were listed from the one expressed by the highest to the one expressed by the lowest percentage of S. aureus-specific CD4+ T cells. Cytokine genes expressed by statistically higher percentages of S. aureus-specific vs. polyclonally-activated CD4+ T cells are indicated by red asterisks while those expressed by higher percentages of polyclonally-activated cells are indicated by blue asterisks. (C) Each symbol represents the percentage of S. aureus-specific or polyclonally-activated CD4+ T cells transcribing CCR6 or CXCR3 from 1 out of 6 donors analyzed. Mean values ± SEM are also shown. (D-F) Three distinct cell populations were FACS-sorted from 4 donors: after HK-S. aureus stimulation OX40-CD137- (AIM-) and AIM+ CD4+ T cells, and after α-CD3/CD28 stimulation AIM+ CD4+ T cells. Cells were rested overnight, stimulated with PMA/Ionomycin for 4 h and stained intracellularly for IL-17A and IFN-γ. (D) Dot plots from a representative donor gating on live, CD4+ T cells. (E) Percentages and (F) Boolean gates of IFN-γ- and/or IL-17A-producing CD4+ T cells from 4 donors. Statistical analysis was performed using paired students t-tests (B, C) or a one-way ANOVA with Dunnett’s test for multiple comparisons (E). *P ≤ 0.05, **P ≤ 0.01, P ≤ ***0.001.
Figure 4
Figure 4
Skin-tropic S. aureus-specific CD4+ T cells are further enriched for IL17A and IL26 gene expression. PBMCs isolated from 6 healthy donors were sorted via negative selection into CD4+ and CD4- fractions. CD4- cells were irradiated and both fractions were re-mixed at a ratio of 1:1. Cells were then stimulated for 24 h with HK S. aureus or α-CD3/CD28 or left untreated. CD4+ T cells expressing the activation markers OX40 and CD137 (AIM+ CD4+ T cells) were index-sorted based on CLA expression via flow-cytometry and scRNA-Seq analysis was performed. (A) The transcription of the 14 cytokine-encoding genes analyzed in Figure 3B was quantified in S. aureus-specific CD4+ T cells separated based on CLA expression. Only IL17A and IL26 were transcribed at statistically significantly higher levels in CLA+ as compared to CLA- cells, as assessed by paired Student’s t-test. *P ≤ 0.05. To confirm transcriptional results at the protein level, AIM+ CD4+ T cells after stimulation with HK S. aureus were FACS-sorted, rested overnight and then re-stimulated with PMA and Ionomycin for 3 h and stained on surface for CLA and intracellularly for IL-17A and IFN-γ. (B) Dot plots from a representative donor are shown. (C) Percentages of IL-17A+ or IFN-g+ cells in CLA+ and CLA- cells of 4 donors are shown. Statistical analysis was performed using paired Student’s t-test. *P ≤ 0.05.
Figure 5
Figure 5
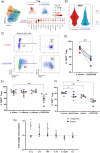
S. aureus-specific Treg present in the blood of healthy subjects express the co-inhibitory receptor TIGIT. (A) Selecting cells from the Treg cluster (in orange in the UMAP), the differentially expressed genes between S. aureus-specific (in red) and polyclonally-activated (in blue) Treg are reported. (B) Violin plot showing on a cell per cell basis the expression of TIGIT in S. aureus-specific and polyclonally-activated Treg. Percentages of cells expressing TIGIT in each group are reported. (C, D) Surface expression of TIGIT on S. aureus-specific and polyclonally-activated Treg identified as CD40L-CD127low CD4+ T cells. (C) Representative dot plots gating on AIM+ cells after S. aureus or α-CD3/CD28 stimulation. (D) Percentages of AIM+ Treg expressing TIGIT in response to each stimulus for 6 donors. (E, F) Percentages of AIM+TIGIT+ Treg after stimulation with (E) HK microorganisms: S. aureus (n = 6 donors), Candida albicans (C. albicans, n = 6 donors), Klebsiella pneumoniae (K. pneumoniae, n = 4 donors), or (F) SARS-Cov2 Spike Protein, Influvac Tetra vaccine (n = 5 donors/stimulus). Polyclonal stimulation with α-CD3/CD28 was done for comparison (n = 6 donors). (G) CD4+ fraction mixed with irradiated CD4- fraction from PBMCs of healthy subjects were stimulated with HK S. aureus as described for AIM assay for 3 d in presence of the antagonist anti-TIGIT mAb Tiragolumab, isotype control mAb or medium alone. Concentrations of cytokines present in cultures supernatants collected at day 3 were measured and expressed as fold induction versus concentrations found in cultures where no antibodies were added (medium, dotted line, n = 4-5 donors, 3 independent experiments). Statistical analysis was performed using a paired t-test (D), or a mixed-effects analysis followed by Dunnet’s multiple comparison test (E, F) or a 2-way ANOVA followed by Sidak’s test for multiple comparisons (G). *P ≤ 0.05, P ≤ **0.01.

References

    1. Ikuta KS, Swetschinski LR, Robles Aguilar G, Sharara F, Mestrovic T, Gray AP, et al. . Global mortality associated with 33 bacterial pathogens in 2019: a systematic analysis for the Global Burden of Disease Study 2019. Lancet. (2022) 400:2221–48. doi: 10.1016/S0140-6736(22)02185-7 - DOI - PMC - PubMed
    1. Murray CJL, Ikuta KS, Sharara F, Swetschinski L, Robles Aguilar G, Gray A, et al. . Global burden of bacterial antimicrobial resistance in 2019: a systematic analysis. Lancet. (2022) 399:629–55. doi: 10.1016/S0140-6736(21)02724-0 - DOI - PMC - PubMed
    1. Clegg J, Soldaini E, McLoughlin RM, Rittenhouse S, Bagnoli F, Phogat S. Staphylococcus aureus vaccine research and development: the past, present and future, including novel therapeutic strategies. Front Immunol. (2021) 12. doi: 10.3389/fimmu.2021.705360 - DOI - PMC - PubMed
    1. Congdon ST, Guaglione JA, Ricketts OMA, Murphy KV, Anderson MG, Trowbridge DA, et al. . Prevalence and antibiotic resistance of Staphylococcus aureus associated with a college-aged cohort: life-style factors that contribute to nasal carriage. Front Cell Infect Microbiol. (2023) 13. doi: 10.3389/fcimb.2023.1195758 - DOI - PMC - PubMed
    1. Wertheim HF, Melles DC, Vos MC, van Leeuwen W, van Belkum A, Verbrugh HA, et al. . The role of nasal carriage in Staphylococcus aureus infections. Lancet Infect Dis. (2005) 5:751–62. doi: 10.1016/S1473-3099(05)70295-4 - DOI - PubMed