. 2025 Jan 17;28(2):111837.
doi: 10.1016/j.isci.2025.111837. eCollection 2025 Feb 21.

Impaired inflammatory resolution with severe SARS-CoV-2 infection in leptin knock out obese hamster

Affiliations

Impaired inflammatory resolution with severe SARS-CoV-2 infection in leptin knock out obese hamster

Ren-Di Jiang et al. iScience. .

Abstract

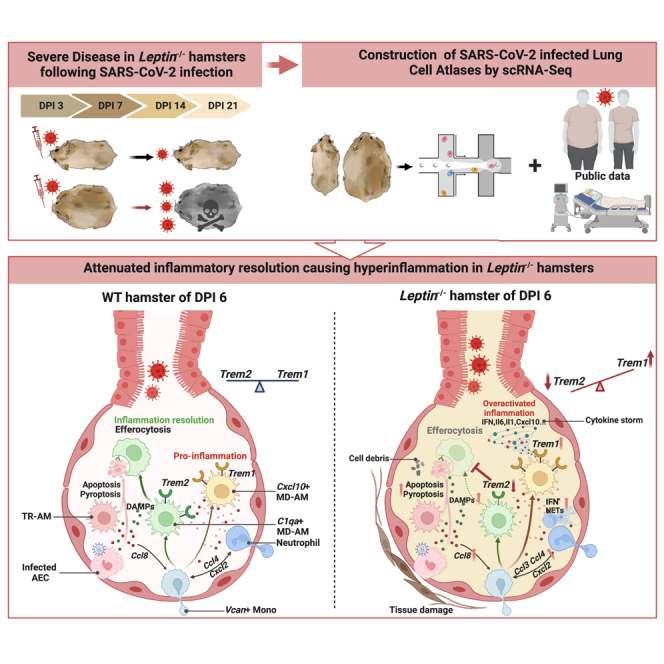
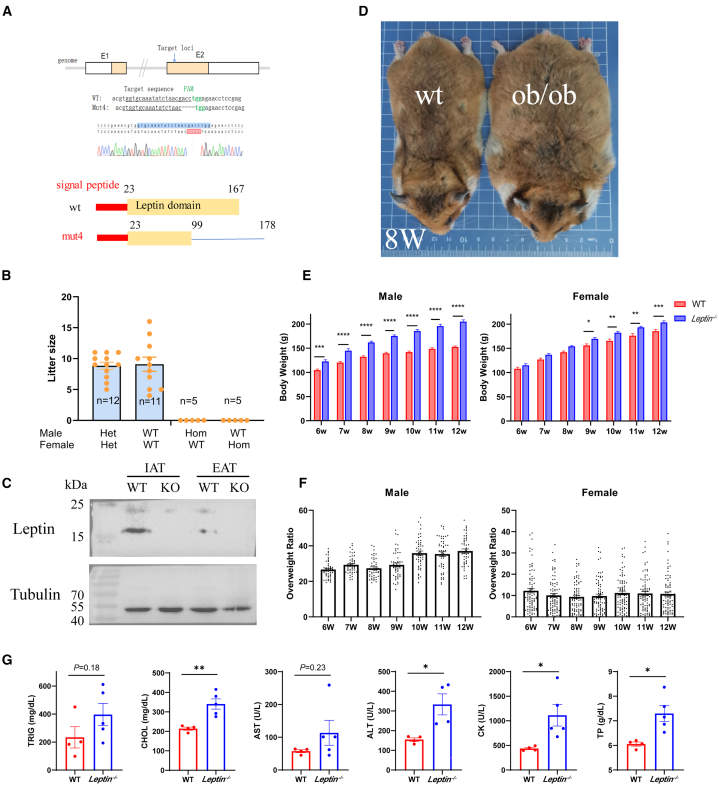
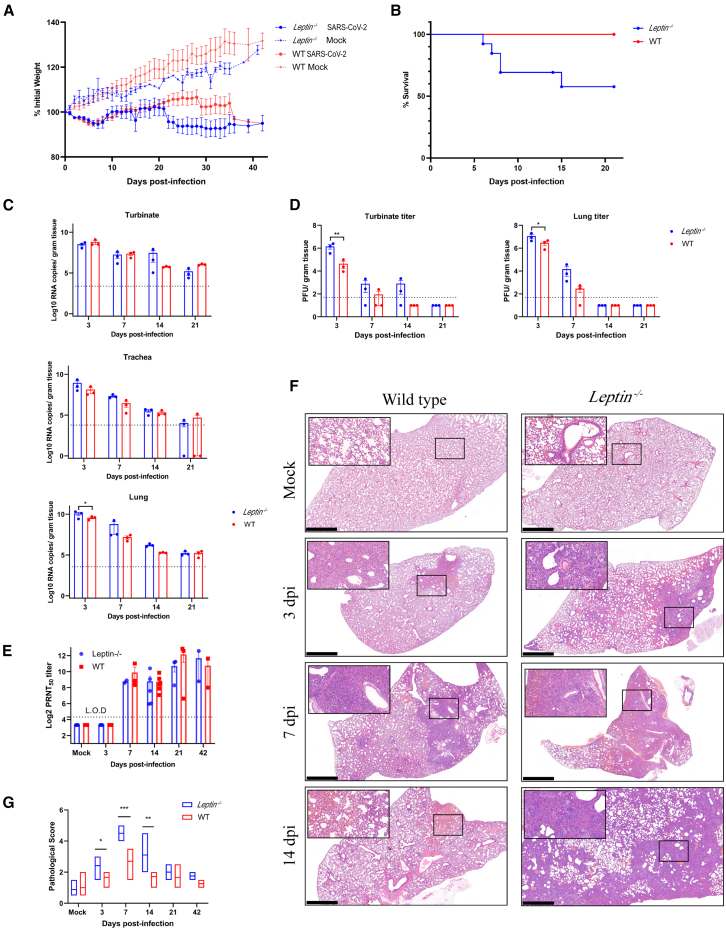
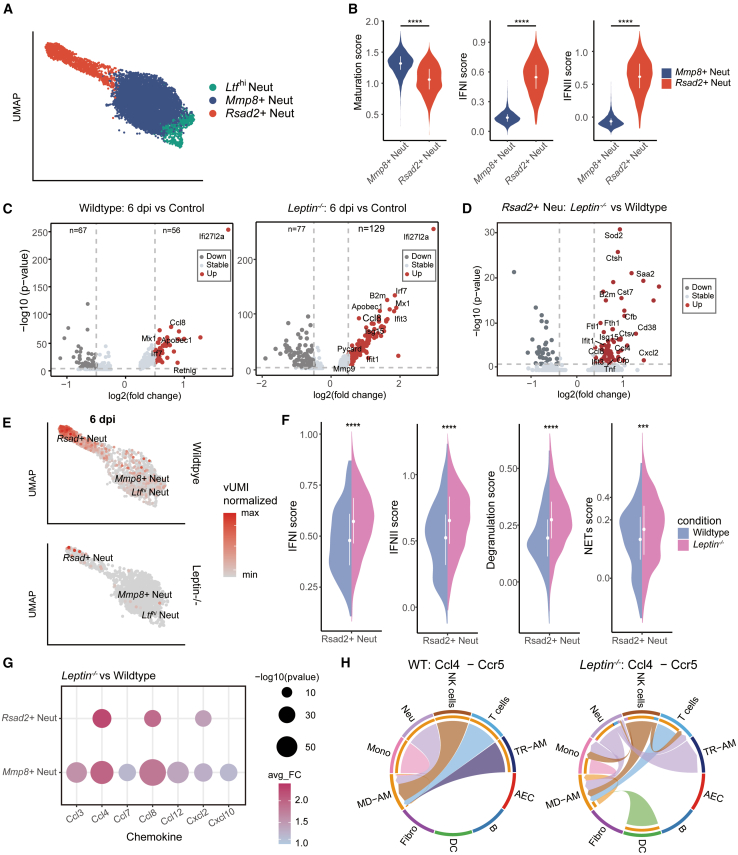
Comorbidities, such as obesity, increase the risk of severe COVID-19. However, the mechanisms underlying severe illnesses in individuals with obesity are poorly understood. Here, we used gene-edited leptin knock out (Leptin -/-) obese hamsters to establish a severe infection model. This model exhibits robust viral replication, severe lung lesions, pronounced clinical symptoms, and fatal infection, mirroring severe COVID-19 in patients with obesity. Using single-cell transcriptomics on lung tissues pre- and post-infection, we found that monocyte-derived alveolar macrophages (MD-AM) play a key role in lung hyper-inflammation, including two unique MD-AM cell fate branches specific to Leptin -/- hamsters. Notably, reduced Trem2-dependent efferocytosis pathways in Leptin -/- hamsters indicated weakened inflammation resolution, consistent with the scRNA-seq data from patients with obesity. In summary, our study highlights the obesity-associated mechanisms underlying severe SARS-CoV-2 infections and establishes a reliable preclinical animal model for developing obesity-specific therapeutics for critical COVID-19.

Keywords: Immune response; Omics; Virology.


Conflict of interest statement

The authors declare no competing interests.

Figures

None
Graphical abstract
Figure 1
Figure 1
Development of leptin-deficient golden hamsters (A) Structure of the golden hamster leptin gene and target locus for sgRNA. Sequencing result shows 4 nucleotide deletion (del4) in leptin-deficient (Leptin−/−) (ob/ob) golden hamster lines, resulting in leptin protein mistranslation. (B) The fecundity of male and female Leptin−/− golden hamsters, Het (Heterozygous), Hom (Homozygous), N = 12 in Het-paired group, N = 11 in WT-paired group, N = 5 in Hom/WT-paired group. (C) Western blots showing the loss of leptin-expression in visceral epididymal adipose tissue (EAT) and subcutaneous inguinal adipose tissue (IAT) of Leptin−/− male golden hamsters. Tubulin was used as the loading control. (D) Image for 8-week Leptin-deficient male golden hamster compared to wildtype (WT). (E) The growth curve of Leptin−/− and WT male and female golden hamsters (N = 9 per group) at 6–12 weeks. (F) Body overweight ratio in Leptin−/− male (N = 6) and female (N = 9) hamster to WT control (male N = 8, female N = 9). (G) Representative biochemical indices between Leptin−/− and WT hamsters at 8 weeks. The errors are presented as mean ± SEM. Statistical significance was measured by Student’s t test (G) and two-way ANOVA (E). ∗p < 0.05, ∗∗p < 0.01, ∗∗∗p < 0.001. See also Figure S1.
Figure 2
Figure 2
SARS-CoV-2 infection resulting in severe disease in Leptin−/− hamsters (A) Body weight was monitored every day until 42 days post-infection (dpi). (B) Several Leptin−/− hamsters died after infection, while WT hamsters were survived during experiments (Leptin−/−n = 13, WT n = 14). (C) Viral RNA level in respiratory tissues collected in 3, 7, 14, 21 dpi was determined by RT-qPCR (n = 3 in each column). (D) Virus titer in turbinate and lung was determined by plaque assay (n = 3 in each column). (E) Serum were collected and the neutralizing antibody titer was determined by PRNT assay (n = 3 in each column). (F) Lung pathological changes were presented after H&E staining, the rectangle symbolizes the magnified region. (G) Pathological score of each lung was determined by double-blind scoring. The dotted line indicates the limitation of detection. Images were acquired by Pannoramic MIDI system and analyzed by CaseViewer 2.4. Black scale bar, 2 mm. The errors are presented as mean ± SEM. Statistical significance was measured by two-way ANOVA (C, D, E) and Student’s t test (H). ∗p < 0.05, ∗∗p < 0.01, ∗∗∗p < 0.001. See also Figures S2–S8.
Figure 3
Figure 3
Construction of SARS-Cov-2 infected Hamster Lung Cell Atlases by scRNA-Seq (A) Schematic diagram of WT and Leptin−/− hamsters subjected to SARS-CoV-2 infection. (B) UMAP embedding of the entire dataset by manual cell type annotation. (C) Normalization of viral UMIs (vUMI) over expected values across 10 cell types, projected on the UMAP embedding. (D) Proportions of the 10 major cell types in WT and Leptin−/− group by scRNA-seq. Plot center, box and error-bar are corresponded to median, interquartile range (IQR) and mean ± SEM, respectively (t-test). ∗p ≤ 0.05, ∗∗p ≤ 0.01, ∗∗∗p ≤ 0.001, ∗∗∗∗p ≤ 0.0001. See also Figures S9–S12.
Figure 4
Figure 4
SARS-CoV-2 infection primes MD-AM for augmented pro-inflammatory functionality and impaired anti-inflammatory functionality (A) UMAP embedding of the Mono and MD-AM subclusters by manual cell type annotation. Red circles indicating emergence of MD-AM post-infection. (B) Bubble plot shows marker genes across 3 monocyte-derived clusters. (C) Volcano plots showing DEGs in C1qa+ MD-AM from Leptin−/− as compared to WT. The x and y axes indicate the expression fold change (FC) (log2) and adjusted p value(−log10) for each gene versus controls, respectively. Legends highlight upregulated (red) or downregulated (blue) genes, as well as genes not passing cutoff criteria (p value <0.05, FC > 1.3) for FC and p value (gray). Selected representative genes are shown. LOC121134329: H2-Q10; LOC101833293: Saa3. LOC101839392: Ccl2. (D) Monocle trajectories of Mono and MD-AM colored by WT and Leptin−/− group. Each dot represents a single cell. Cell orders are inferred from the expression of the most variable genes across all cells. Trajectory directions were determined by biological prior. (E) Heatmap of the top 50 genes that were differentially expressed in each cell fate branch. See also Figures S13–S17.
Figure 5
Figure 5
Transcriptome dynamics in neutrophils in SARS-CoV-2 infected lung (A) UMAP embedding of the neutrophils subclusters by manual cell type annotation. (B) Violin plot of maturation, type I IFN and type II IFN scores for Mmp8+ neutrophils and Rsad2+ neutrophils, with dots indicate median values, upper/lower line extend from the hinge to 25th to 75th percentiles value. Colored areas indicate density distribution of data. (C) Volcano plots showing DEGs in Mmp8+ neutrophils from 6 dpi versus control. The x and y axes indicate the expression fold change (FC) (log2) and adjusted p value(−log10) for each gene versus controls, respectively. Legends highlight upregulated (red) or downregulated (dark gray) genes, as well as genes not passing cutoff criteria (p value <0.05, log2FC > 0.5) for FC and p value (gray). Selected representative genes are shown. (D) Volcano plots showing DEGs in Rsad2+ neutrophils from Leptin−/− versus Wlidtype. Selected representative genes are shown. (E) Normalization of viral UMIs (vUMI) over expected values across neutrophils cell types, projected on the UMAP embedding. (F) Violin plot of IFN-related and NETs-related gene-set scores for Rsad2+ neutrophils in Leptin−/− and WT groups, with dots indicate median values, upper/lower line extend from the hinge to 25th to 75th percentiles value. Colored areas indicate density distribution of data. (G) Bubble plot showing gene of SARS-CoV-2 infection induced DEGs of neutrophils subclusters involved in chemokine genes. The size of plots indicates the p values and the color scale indicates the FC. (H) Chord diagram visualizing cell-cell communication with Ccl4-Ccr5. See also Figure S18.
Figure 6
Figure 6
Attenuated inflammatory resolution of C1qa+ MD-AMs in Leptin−/− hamsters (A) Heatmap of module score of inflammatory resolution of immunity cells. (B) Violin plot of average expression of efferocytosis-related genes. Green bar representing sender cells, orange bar representing receiver cells. Genes in dark blue meaning ligands, red meaning receptors. (C) GO enrichment of target genes in receiver cells regulated by upregulated ligands in C1qa+ MD-AMs in WT and Leptin−/− hamsters. See also Figures S19 and S20.
Figure 7
Figure 7
Imbalance expression and proportion of Trem1/Trem2 (A) Bar plot of proportions of Trem1/Trem2 cells in WT and Leptin−/− hamsters. The number of Trem1/Trem2 cells is shown. (B) Violin plot of Trem1 and Trem2 for monocytes-derived cells of different conditions. ∗P ≤ 0.05, ∗∗P ≤ 0.01, ∗∗∗P ≤ 0.001. (C) Plots expression for Trem1 and Trem2 following pseudotime in WT and Leptin−/− hamsters. (D) UMAP embedding of the MD-AM subclusters from BALF of COVID-19 patients. Red circles indicating pro-inflammatory cells and blue circles indicating anti-inflammatory cells. (E) Bar plot of proportions of TREM2+ cells in BMI level 2,3 of clinic data. (F) Violin plot of TREM1 and TREM2 for MD-AMs in BMI level 2, 3. (G and H) Violin plot of efferocytosis score in clinic data. See also Figures S21 and S22.

References

    1. Banerjee A., Pasea L., Harris S., Gonzalez-Izquierdo A., Torralbo A., Shallcross L., Noursadeghi M., Pillay D., Sebire N., Holmes C., et al. Estimating excess 1-year mortality associated with the COVID-19 pandemic according to underlying conditions and age: a population-based cohort study. Lancet. 2020;395:1715–1725. doi: 10.1016/S0140-6736(20)30854-0. - DOI - PMC - PubMed
    1. Zsichla L., Müller V. Risk Factors of Severe COVID-19: A Review of Host, Viral and Environmental Factors. Viruses. 2023;15:175. - PMC - PubMed
    1. Qin C., Zhou L., Hu Z., Zhang S., Yang S., Tao Y., Xie C., Ma K., Shang K., Wang W., Tian D.S. Dysregulation of Immune Response in Patients With Coronavirus 2019 (COVID-19) in Wuhan, China. Clin. Infect. Dis. 2020;71:762–768. doi: 10.1093/cid/ciaa248. - DOI - PMC - PubMed
    1. Russell C.D., Lone N.I., Baillie J.K. Comorbidities, multimorbidity and COVID-19. Nat. Med. 2023;29:334–343. doi: 10.1038/s41591-022-02156-9. - DOI - PubMed
    1. Popkin B.M., Du S., Green W.D., Beck M.A., Algaith T., Herbst C.H., Alsukait R.F., Alluhidan M., Alazemi N., Shekar M. Individuals with obesity and COVID-19: A global perspective on the epidemiology and biological relationships. Obes. Rev. 2020;21 doi: 10.1111/obr.13128. - DOI - PMC - PubMed

LinkOut - more resources